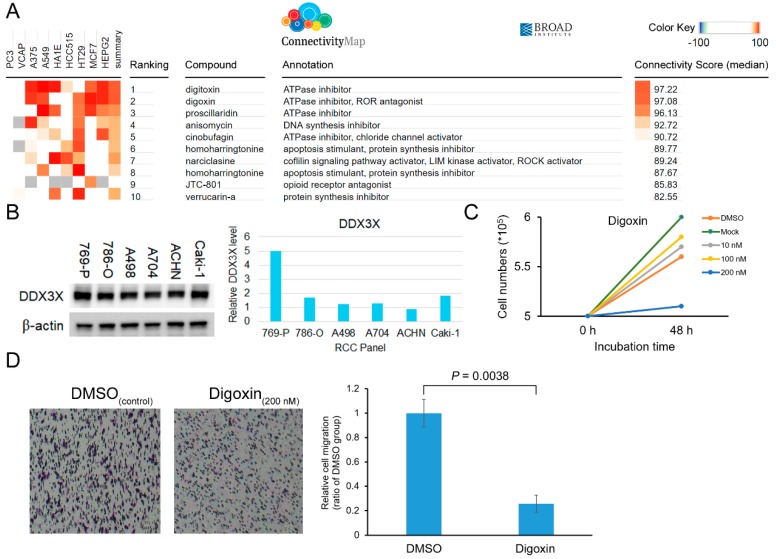
Figure 4.
(A) The gene signature obtained by the high DDX3X group versus the low DDX3X group was analyzed via the L1000 platform of Connectivity Map. The drugs of the candidate were shown and ranked according to the connectivity score. (B) The relative DDX3X expression level was investigated in 7 clear cell subtype RCC cell lines by Western Blot. (C) ACHN cell numbers were counted by trypan blue exclusion assay upon 48 h of digoxin treatment. (D) ACHN cell migration was evaluated by transwell assay after 48 h of 200 nM digoxin treatment.

