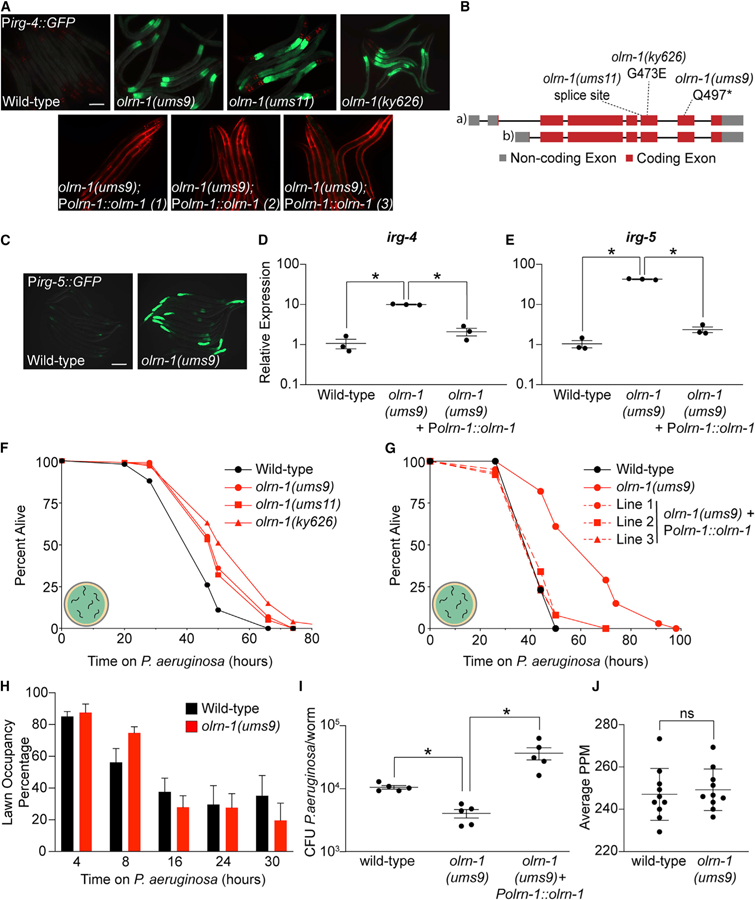
Figure 1. Loss-of-Function Mutations in olrn-1 Cause Constitutive Immune Activation.

(A) Images of olrn-1 mutants and three independent rescue lines with olrn-1 expressed under the control of its own promoter in the Pirg-4::GFP immune reporter background are shown. Red pharyngeal expression is the Pmyo-2::mCherry co-injection marker, which confirms the presence of the Pirg-4::GFP transgene. The Pmyo-3::mCherry co-injection marker confirms expression of the Polrn-1::olrn-1 construct in the rescue lines.
(B) Schematic of the olrn-1 locus with the locations of the ums9, ums11, and ky626 mutations is shown.
(C) Immune reporter Pirg-5::GFP in the olrn-1(ums9) background is shown.
(D and E) Presence of the Pirg-5::GFP transgene was confirmed by assaying for the Rol phenotype. qRT-PCR data of irg-4 (D) and irg-5 (E) of the indicated genotypes is presented. Data are the average of three independent replicates, each normalized to a control gene, with error bars representing SEM, Data are presented as the value relative to the average expression from all replicates of the indicated gene in wild-type animals. *p < 0.05 by one-way ANOVA for the indicated comparison.
(F and G) C. elegans pathogenesis assay conducted with a large lawn of P. aeruginosa and C. elegans of indicated genotypes at L4 is shown. Data are representative of three trials. The Kaplan-Meier method was used to estimate the survival curves for each group, and the log rank test was used for all statistical comparisons. Sample sizes, mean lifespan, and p values for all trials are shown in Table S2.
(H) Quantification of the propensity of olrn-1(ums9) and wild-type animals to avoid a lawn of P. aeruginosa is shown. Data are presented as the average number of animals that were on a small lawn of P. aeruginosa from three separate replicates, with error bars representing SEM. There is no significant difference by one-way ANOVA between these mutants, except at the 8-h time point.
(I) P. aeruginosa, isolated from the intestines of animals with the indicated genotypes, was quantified after 24 h of bacterial infection. Data are colony-forming units (CFUs) of P. aeruginosa and are presented as the average of five separate replicates, with each replicate containing 10–11 animals. *p < 0.05 by one-way ANOVA for the indicated comparison.
(J) Data are the pharyngeal pumping rates, recorded as pumps per minute (PPM), of 10 individual young adult C. elegans feeding on non-pathogenic OP50 in wild-type and olrn-1(ums9) mutants, with error bars representing SEM. ns indicates no significant difference by one-way ANOVA for the indicated comparison.
Scale bars in (A) and (C) are 100 μm. See also Figure S1.
