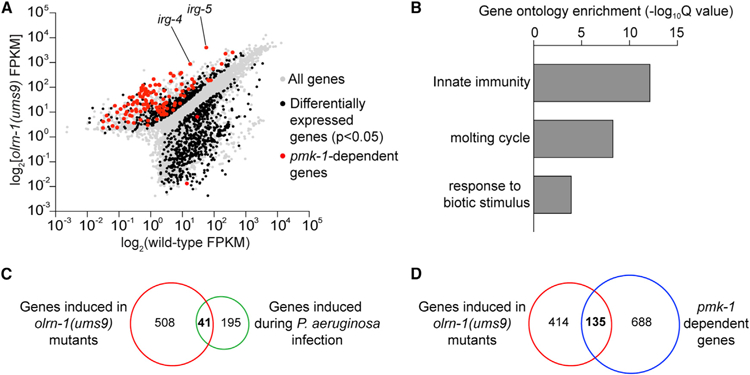
Figure 2. olrn-1 Suppresses Innate Immune Effector Expression.

(A) Data from an mRNA sequencing (mRNA-seq) experiment comparing gene expression in olrn-1(ums9) mutants with wild-type animals are shown. All genes are shown in gray. Genes that are differentially expressed in olrn-1(ums9) mutants compared with wild-type animals are shown in black (fold change > 2, p < 0.05). Genes that are known targets of the p38 MAPK pmk-1 pathway are highlighted in red. The locations of the representative genes irg-4 and irg-5, whose expression is examined throughout this manuscript, are shown.
(B) Gene Ontology enrichment analysis for the 549 genes whose transcription was significantly upregulated in olrn-1(ums9) mutants compared with wild type is shown. The three most significantly enriched categories are shown, reported as the —log10 transformation of the Q value for the enrichment of each category.
(C and D) Venn diagrams show the overlap of the 549 genes upregulated in olrn-1 mutants with genes that are known to be induced during P. aeruginosa infection (C) and are targets of the p38 MAPK PMK-1 pathway (D). Hypergeometric p values for the overlap in (C) and (D) are 3.22e–21 and 9.10e–67, respectively.
See also Figure S2.
