
Figure 3. olrn-1 Suppresses the p38 MAPK PMK-1 Innate Immune Pathway.
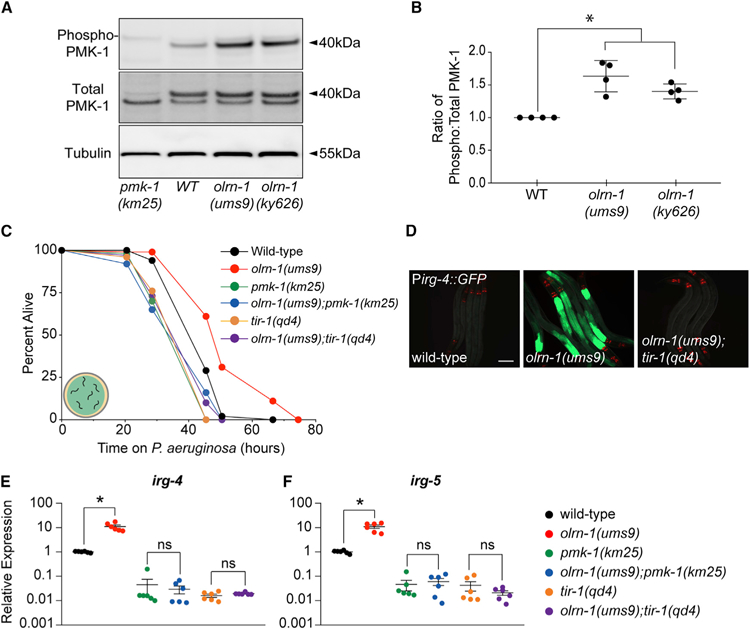
(A) Immunoblot analysis of lysates from animals of the indicated genotype using antibodies that recognize the doubly phosphorylated TGY motif of PMK-1 (phospho-PMK-1), the total PMK-1 protein (total PMK-1), and tubulin is shown. PMK-1 is a 40 kDa protein, and tubulin is a 55 kDa protein.
(B) Band intensities of four biological replicates of the western blot shown in (A) were quantified. The ratio of active to total PMK-1 is shown for each genotype and is presented relative to the ratio in wild-type animals for each replicate. *p < 0.05 by one-way ANOVA for the indicated comparison.
(C) C. elegans pathogenesis assay conducted with a large lawn of P. aeruginosa and C. elegans of indicated genotypes at L4 is shown. Data are representative of three trials. The Kaplan-Meier method was used to estimate the survival curves for each group, and the log rank test was used for all statistical comparisons. Sample sizes, mean lifespan, and p values for all trials are shown in Table S2.
(D) Images of olrn-1(ums9) mutants and olrn-1(ums9);tir-1(qd4) double mutants are shown. Red pharyngeal expression is the Pmyo-2::mCherry co-injection marker, which confirms the presence of the Pirg-4::GFP transgene. Scale bar is 100 μm.
(E and F) qRT-PCR data show irg-4 (E) and irg-5 (F) expression in the indicated genotypes. Data are the average of six independent replicates, each normalized to a control gene, with error bars representing SEM. Data are presented as the value relative to the average expression from all replicates of the indicated gene in wild-type animals. *p < 0.05 by one-way ANOVA for the indicated comparison. ns denotes that the difference between the indicated comparisons was not statistically significant.