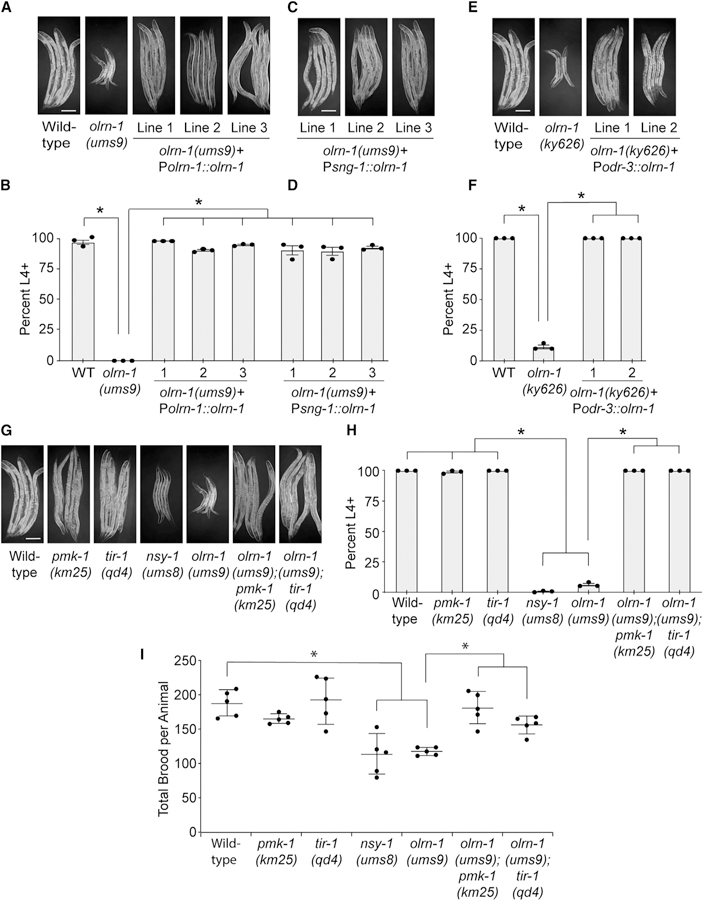
Figure 4. Promotion of Intestinal Immune Homeostasis by olrn-1 Is Required to Ensure Reproduction and Development.

(A–H) Development assays were performed with the indicated genotypes. The stage of the animals was recorded at the same time point, approximately 72 h after eggs from C. elegans of the indicated genotypes were laid. In (B), (D), (F), and (H), data are presented as the average number of animals for each genotype that were at L4 or older (percent L4+) from three independent replicates, with error bars representing SEM. *p < 0.05 by one-way ANOVA. The stage that was recorded for each animal in these assays and the sample size for all replicates are presented in Table S2. The animals in (A), (C), (E), and (G) were from the same trial and were photographed together. The same photographs of the control genotypes [wild-type and olrn-1(ums9)] are shown in (A), (E), and (G) to make interpretation of the figure easier.
(I) Brood sizes from animals of the indicated genotypes were quantified. Each data point is the average brood size from two animals. *p < 0.05 by one-way ANOVA for the indicated comparison. The data for each replicate are presented in Table S2.
Scale bars in (A), (C), (E), and (G) are 100 μm. See also Figure S3.
