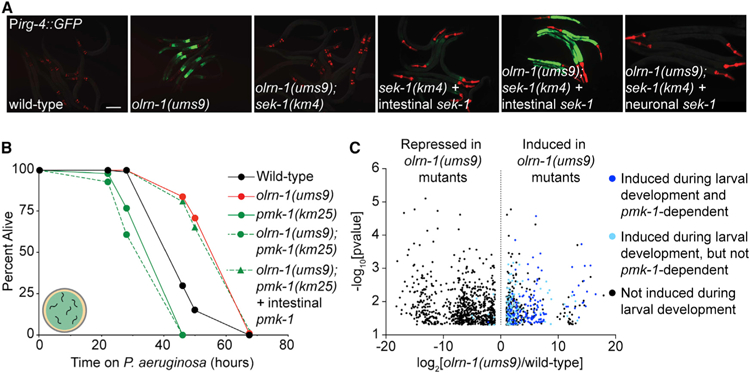
Figure 6. Immune Effectors Regulated by Neuronal olrn-1 Are Dynamically Expressed during Nematode Development.

(A) Representative images of animals with the indicated genotypes carrying an integrated Pirg-4::GFP reporter. Red pharyngeal expression is the Pmyo-2::mCherry co-injection marker, which confirms the presence of the Pirg-4::GFP transgene. Bright red pharyngeal expression in C. elegans with intestinal sek-1 (Pges-1::sek-1::GFP) and neuronal sek-1 (Punc-119::sek-1::GFP) is the Pmyo-2:mStrawberry co-injection marker. The presence of the Pirg-4::GFP reporter was confirmed in these animals by Pmyo-2::mCherry expression in siblings that did not contain the indicated extrachromosomal arrays. Scale bar is 100 μm.
(B) C. elegans pathogenesis assay conducted with a large lawn of P. aeruginosa and C. elegans of indicated genotypes at L4 is shown. Data are representative of three trials. Sample sizes, mean lifespan, and p values for all trials are shown in Table S2. ‘‘Intestinal pmk-1’’ indicates that these animals have the Pvha-6::pmk-1 extrachromosomal array.
(C) Volcano plot of the mRNA-seq transcriptome profiling analysis shows all genes that were differentially expressed in olrn-1(ums9) mutants compared with wild-type animals (fold change > 2, p < 0.05), as described in Figure 2A. Highlighted in dark blue are the genes whose transcription are (1) dependent on the p38 MAPK pmk-1 (from the overlap in Figure 2D) and (2) induced in wild-type animals at L1, L2, L3, or L4 compared with wild-type young adult animals. Highlighted in light blue are the genes that are induced in L1, L2, L3, or L4 wild-type nematodes compared with adult animals but whose transcription does not depend on p38 MAPK pmk-1.
Venn diagrams showing the overlap of genes that are induced at each larval stage compared with genes that are induced in olrn-1(ums9) mutants are shown Figure S5A. See also Figure S5.
