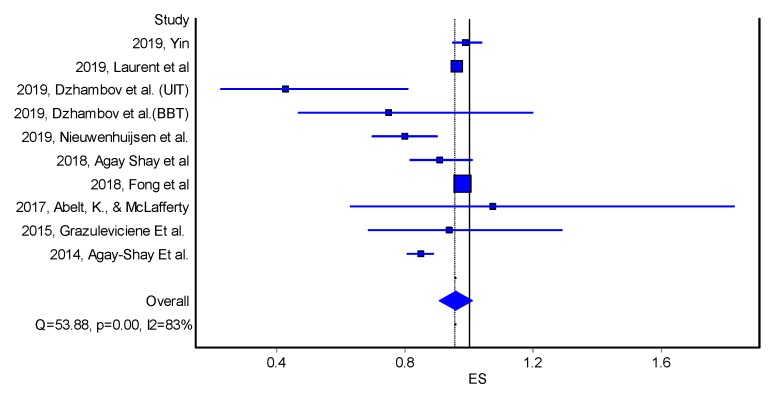
Figure 3.
Forest plot on the effect of residential greenness (NDVI) on low birth weight (odds ratio, quality effects model). Note: ES—effect size; Q and I2—heterogeneity statistics. Horizontal lines, square and diamond symbols are indicating confidence intervals, effect estimates and overall effect, respectively.

