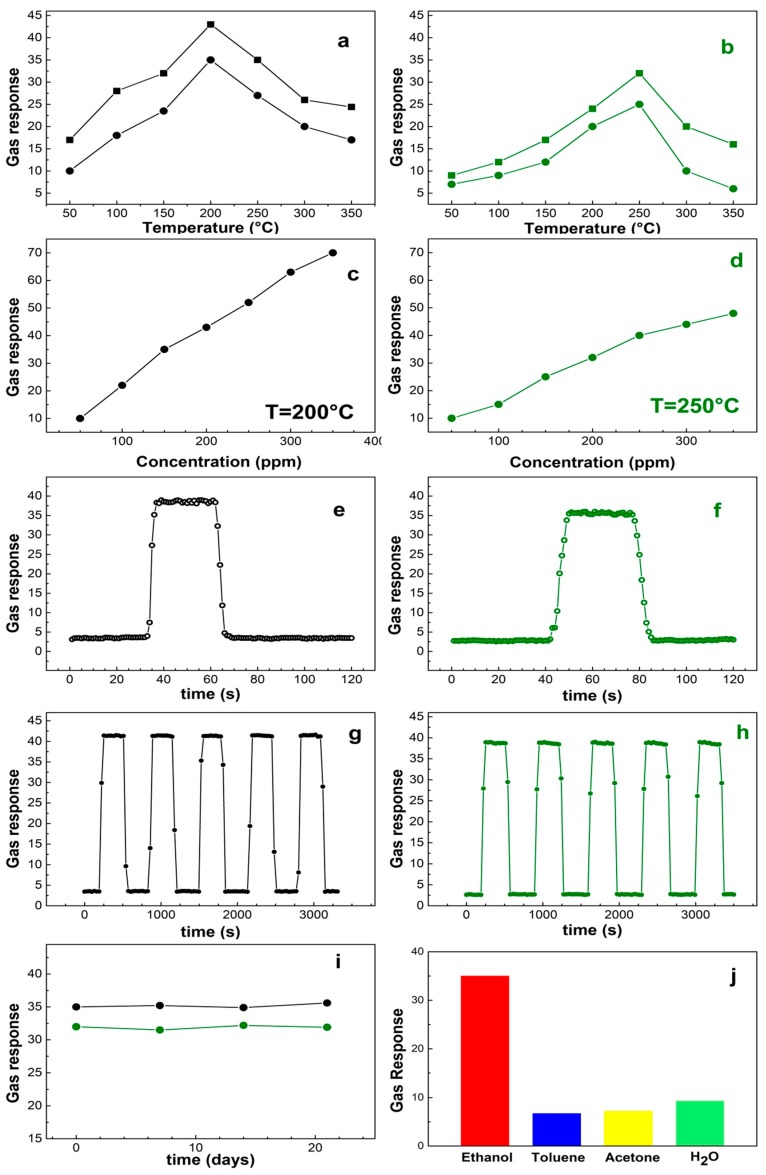
Figure 3.
Plots of the gas responses. (a–h): the left panels correspond to grained-flower NiO, the right ones to the NiO nanoparticles. (a,b) are the gas response vs. temperature of sensors exposed to 150-ppm (solid dots) and 200-ppm (solid squares) ethanol, respectively. The gas responses vs. concentration are reported at 200 °C for the grained-flower (c) and 250 °C for the nanoparticles (d). (e,f) are response/recovery time; (g, h) repetitivety over time. Panel (i) is the response of the grained-flower sensor (black line) at 200 °C to 150-ppm ethanol and nanoparticles sensor (green line) to 200-ppm ethanol at 250 °C, over time (3 weeks) and (j) the response of the grained-flower sensor at 200 °C to 150-ppm ethanol, toluene, acetone, and water.

