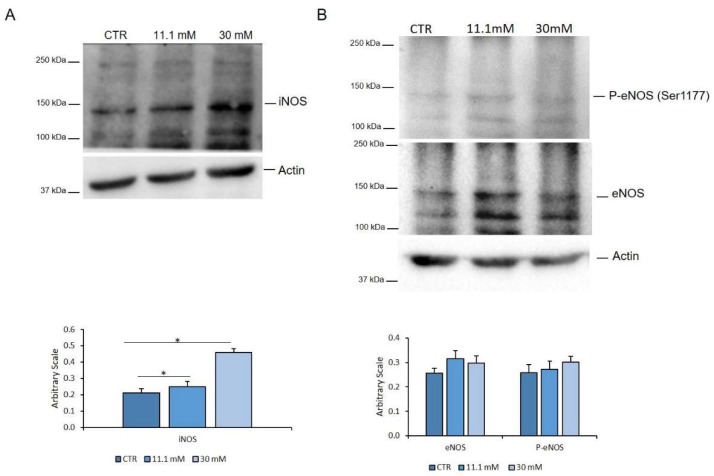
Figure 4.
iNOS and eNOS in HUVEC exposed to different concentrations of glucose. HUVEC were cultured in a medium containing 5 mM (CTR), 11.1 and 30 mM glucose for 24 h. Western blot was performed using specific antibodies against iNOS (A), P-eNOSSer1177, and eNOS (B). Actin was used as a marker of loading. The experiments were repeated three times and a representative blot is shown. Densitometry was performed by Image J software calculating the ratio between the protein of interest and actin on three separate experiments ± SD. * p < 0.05.

