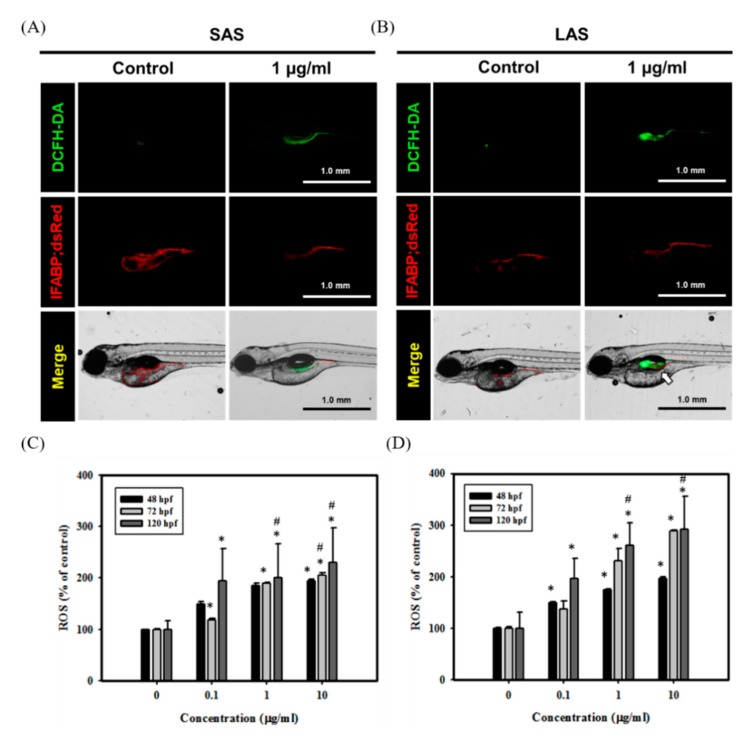
Figure 7.
SAS/LAS induced excessive ROS in zebrafish embryos and damaged the intestinal region. Transgenic zebrafish (Tg(IFABP;dsRed)) embryos were treated with 1 µg/mL of (A) SAS and (B) LAS for observing the intestinal region and ROS production at 120 hpf. The ROS levels were analyzed via DCFH-DA assay. GFP fluorescence signals indicate ROS. RFP fluorescence signals represent the intestinal region. The white arrow indicates the excessive ROS in LAS group. ROS production of (C) SAS- (D) LAS-treated groups (0, 0.1, 1, and 10 µg/mL) were quantified at 48, 72 and 120 hpf. Quantification of ROS levels was performed with TissueQuest software. The values are presented as the means ± SEM. Values that are significantly different from the control are indicated by asterisks (one-way ANOVA, followed by a t-test: *, p< 0.05, control versus exposed groups. #, p< 0.05).

