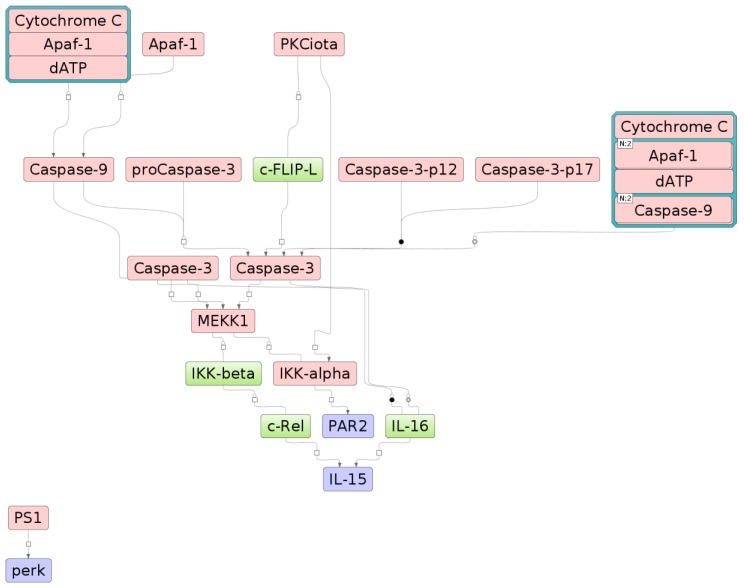
Figure 3.
The signal transduction pathway is represented as a network diagram shown in SBGN format (Systems biology graphical notations). Proteins that are involved in the pathway are shown as green bars with names of the proteins. Complexes of the proteins are shown by combining several proteins in one node. Nodes on the diagram are connected by lines that represent reactions (binding, phosphorylation, and other types of signaling reactions). Relationship between the components of the neurotrophic signaling pathway with the F2RL1 (PAR2), EIF2AK3 (PERK), and IL15 genes. The proteins encoded by the genes of the master regulators PAR2, PERK, and IL15 are highlighted in blue. The components of the neurotrophic signaling pathway are highlighted in red. The blue border around the input points from neurotrophic signaling.

