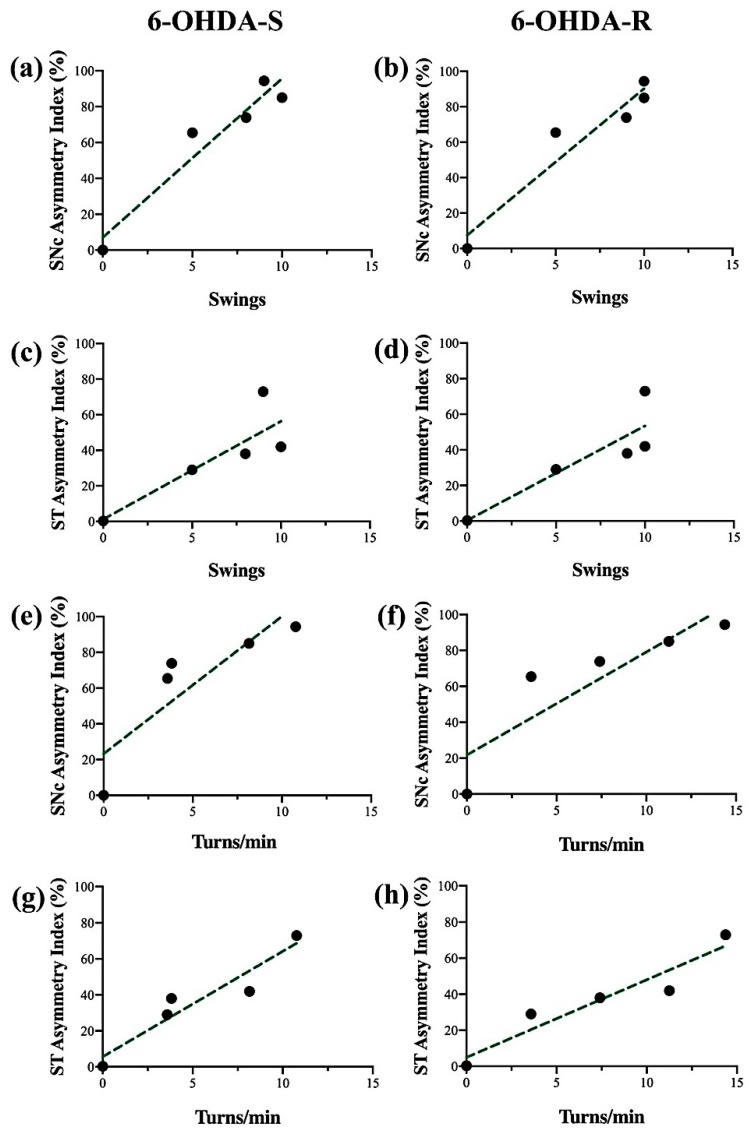
Figure 5.
Regression analysis of contralateral TSST swings (a–d) and RT turns/min (e–h) versus the SNc asymmetry index % nigral cell loss (a,b,e,f) and ST asymmetry index % terminal fiber loss (c,d,g,h) for the animals subjected to single (6-OHDA-S, left column) and repeated (6-OHDA-R, right column) apomorphine administration.

