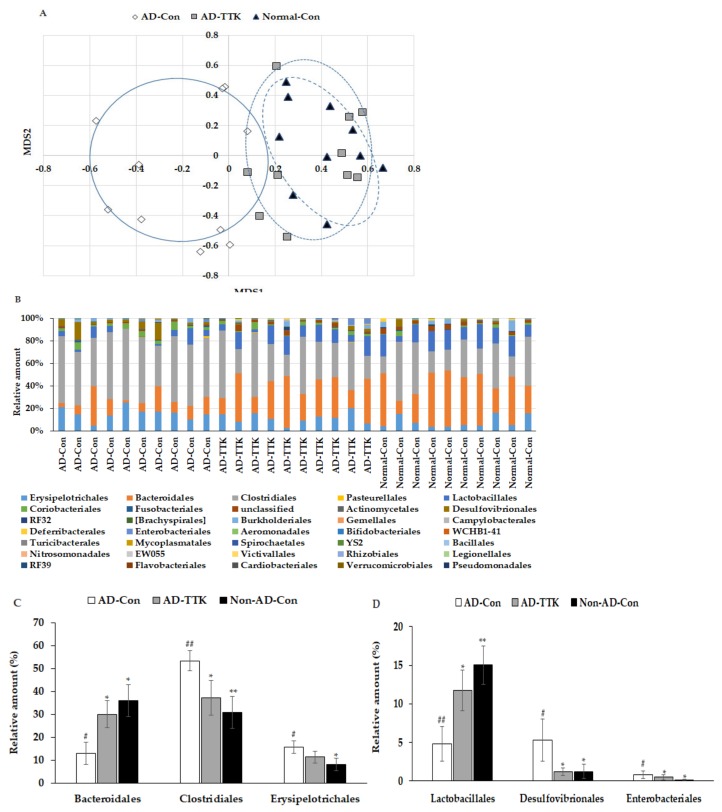
Figure 6.
Profiles of gut microbiomes. At the end of the experiment, feces were collected from the cecum, and the bacterial DNA was analyzed using the next generation sequencing method. (A) Principal coordinate analysis (PCoA) of fecal bacteria. (B) Relative amount (%) of fecal bacteria in the [order] level. (C) Relative amount (%) of Bacteriodales, Clostridales, and Erysipelotrichales in the cecum. (D) Relative amount (%) of Lactobacillales, Desulfovibrionales, and Enterobacteriales in the cecum. AD-Con fed 45% fat diet with 0.5% dextrin in AD rats infused intra-CA1 infusion of amyloid-β(25–35), AD-TTK fed 45% fat diet with 0.5% water extract of Tetragonia tetragonioides (TTK) in AD rats, and Normal-Con fed 45% fat diet with 0.5% dextrin in non-AD rats infused intra-CA1 infusion of amyloid-β(35–25). Each value represents the mean ± SD of five mice in each group. # Significantly different among the groups in one-way ANOVA at p < 0.05 and ## p < 0.01. * Significantly different from AD-Con at p < 0.05, ** p < 0.01, and *** p < 0.001 in the Tukey test. † Significantly different from the Normal-Con at p < 0.05 in the Tukey test.

