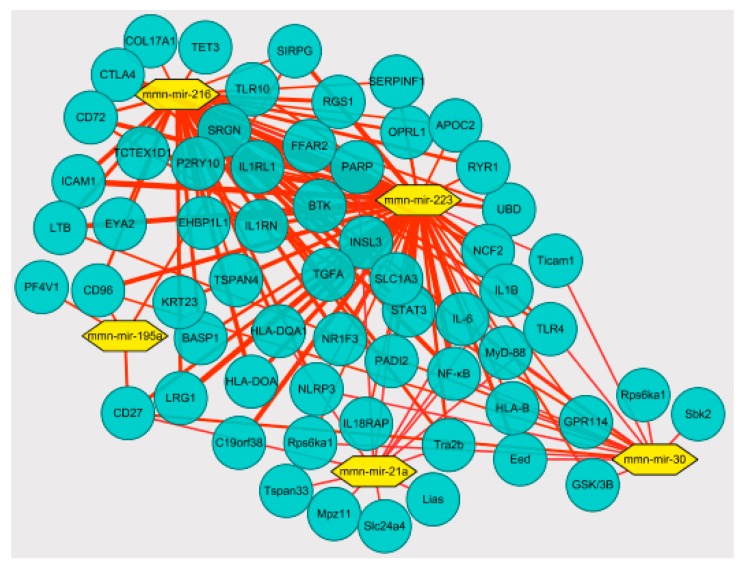
Figure 4.
The miR-223 targeted regulation of the TLR4/MyD-88-NF-κB map. According to the data file of the targeting relationship between differentially expressed miRNAs and mRNA, Cytoscape software was imported for visual operation, and the relationship between mRNA and miRNAs was produced. The network included 5miRNAs and multiple mRNAs, including genes related to inflammation. The blue nodes represent mRNA; the yellow nodes represent miRNAs.

