Figure 3.
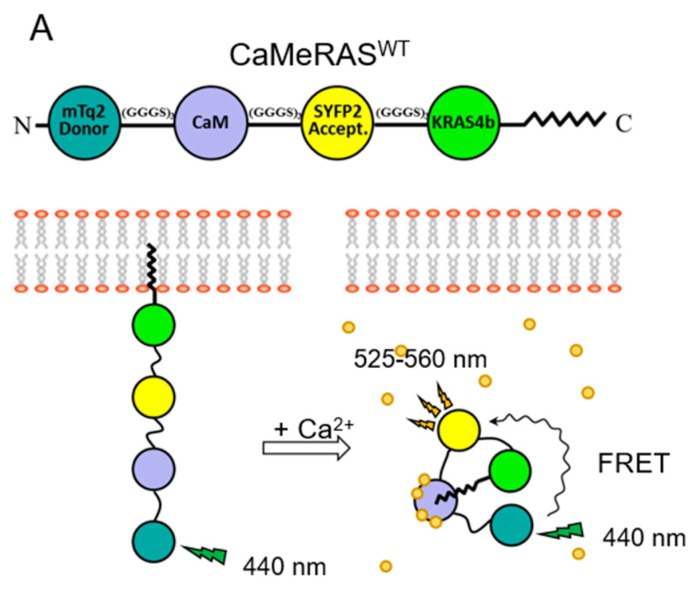
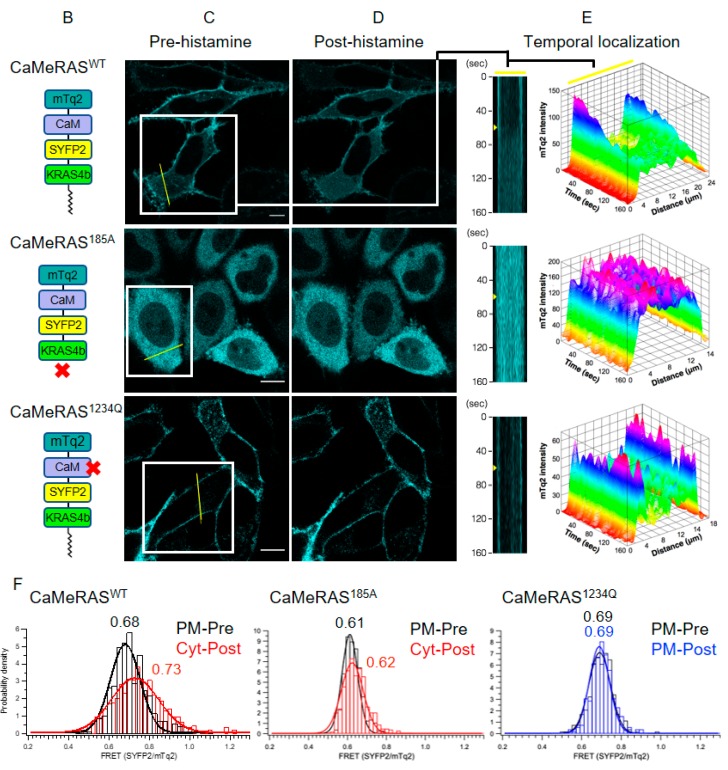
CaMeRAS demonstrates reversible Ca2+-/farnesyl-dependent internalization and FRET change. (A) Schematic of CaMeRAS and bimodal use for CaM-KRAS4b binding model validation. When transiently expressed in mammalian cells, the chimeric construct is natively processed at the C-terminal CaaX box (i.e., farnesylation of Cys185, cleavage of aaX residues, and carboxymethylation of the new C-terminus), allowing tethering of the construct to the plasma membrane. Upon cytosolic Ca2+ elevation, Ca2+-CaM extracts KRAS4b from the membrane, visible with fluorescence imaging, and the structural rearrangement of the chimera leads to detectable FRET. (B) Schematic of CaMeRAS variants transiently expressed in each experiment: CaMeRASWT (comprised of wild-type CaM and KRAS4b), CaMeRAS185A (KRAS4b Cys185 mutated to Ala to prevent farnesylation), and CaMeRAS1234Q (a key residue involved in coordination of Ca2+ in each of the four EF hands in CaM was mutated [i.e., E31Q, E67Q, E104Q and E140Q] to impair binding of Ca2+. An X indicates where each mutant is deficient. (C–F) After loading the cells with 10 µM Calbryte 630AM (AAT Bioquest), imaging was performed at room temperature using a Leica SP8 confocal microscope with a 63x/1.4 numerical aperture (NA) oil immersion objective lens and high-sensitivity HyD detectors. For simultaneous visualization of mTq2, SYFP2, and Calbryte 630, a 440-nm solid state laser and a white light laser tuned to 608 nm were used for excitation of mTq2 and Calbryte 630, respectively, and fluorescence emission was collected at 455 to 490 nm (mTq2), 525 to 560 nm (SYFP2), and 620 to 750 nm (Calbryte). Images were acquired at 3.4 to 4.0 s per frame. (C) Cellular localization (mTq2) of CaMeRAS constructs before histamine stimulation in HeLa cells. CaMeRASWT and CaMeRAS1234Q, farnesylated constructs, are localized on the plasma membrane, while CaMeRAS185A is distributed in the cytoplasm. Scale bars measure 10 μm. (D) Cellular localization (mTq2) of constructs at 60 s after treatment with 100 μM histamine. The CaMeRASWT localization becomes cytoplasmic over time while CaMeRAS185A and CaMeRAS1234Q mutants retain their prior localization. (E) Representative mTq2 intensity distributions over time for cellular cross-sections (yellow lines in (C)) show changes in cellular localization following histamine stimulation at 60 s (yellow arrowheads) after starting imaging. CaMeRASWT experiences a shift from plasma membrane to cytosol while the membrane and cytosolic localization of CaMeRAS185A and CaMeRAS1234Q remain unperturbed. (F) FRET was measured by comparing the ratio of mTq2 to SYFP2 emissions within many small segments along the plasma membrane (PM) and in the cytoplasm (Cyt) before and after histamine stimulation. Histograms of FRET readouts (ratio of SYFP2/mTq2 emissions) pre- and post-stimulation. CaMeRASWT shows a significant change in FRET signal post histamine as it translocates from PM to Cyt (left). A minor FRET change was observed in Cyt for CaMeRAS185A (middle), likely due the conformational change of CaM in response to Ca2+ binding. No FRET change was detected for CaMeRAS1234Q (right). Data fitting the normal distributions was performed by using Gaussian functions. (Adapted from Grant et al. 2020; Reference [55]).


