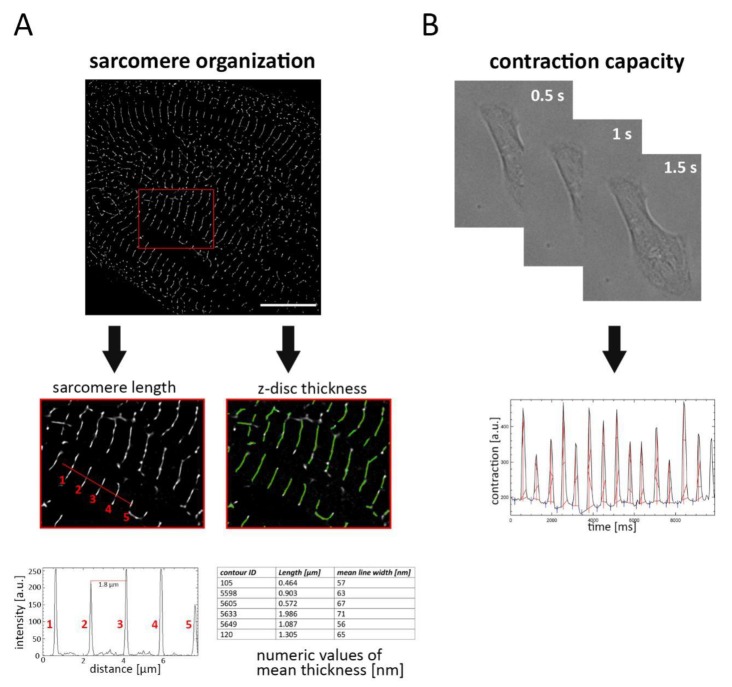
Figure 1.
Strategy for investigating the sarcomere organization and cell contraction in cardiomyocytes (CM). (A) CM were labelled with α-actinin antibody and subjected to photoactivated localization microscopy (PALM) imaging. Following image acquisition and data reconstruction, sarcomere length and z-disc thickness were determined. Sarcomere length was evaluated by measuring the distance between intensity peaks, corresponding to adjacent α-actinin labelled filaments (1–5). z-disc thickness was automatically analyzed, and the mean width of each filament was calculated. (B) To estimate contraction capacity, beating single cells were captured and cell movement was estimated by measuring the change of pixel intensity. Scale bar 10 µm.

