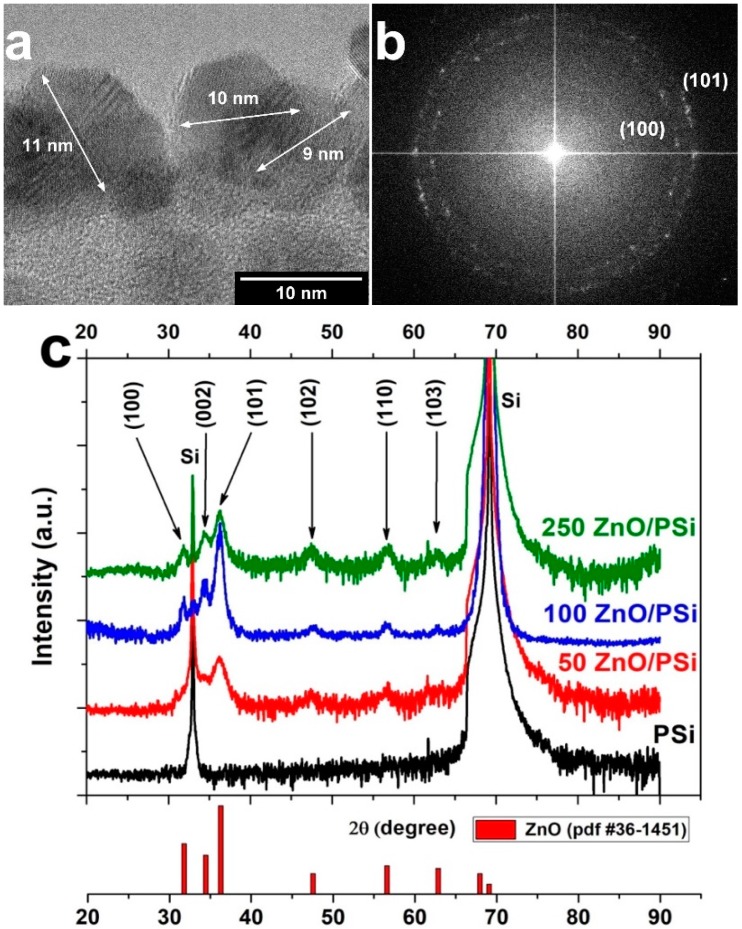
Figure 2.
(a) TEM imaging of ZnO nanocrystallites on PSi obtained after 100 ALD cycles; (b) FFT of the PSi/ZnO TEM image; (c) GIXRD spectra of PSi/ZnO nanocomposites with 250, 100, and 50 ALD cycles of ZnO in comparison to GIXRD spectrum of PSi. Standard diffraction peaks of wurtzite (pdf card #36-1451) are presented for reference.

