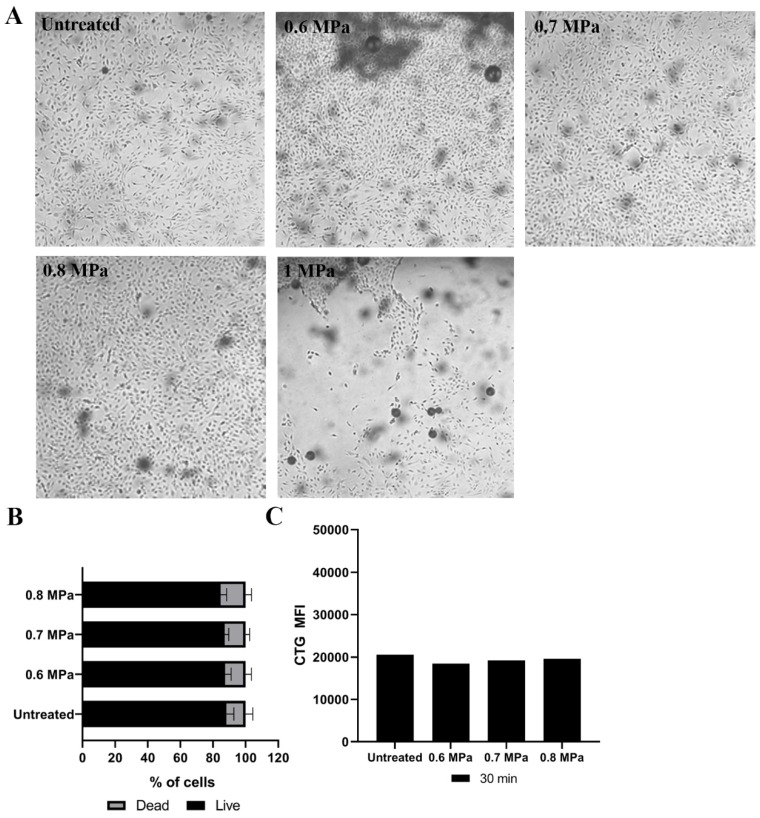
Figure 1.
Human endothelial cells (HUVECs) stained with CellTracker™ green fluorescent dye (CTG) and treated at different ultrasound (US) acoustic pressures. Microscopy pictures of HUVECs captured before (untreated) and directly after US treatment (0.6, 0.7, 0.8 and 1 MPa) are presented at 10× magnification (A). Afterwards, cells were harvested and stained with PI to determine live and dead cells. The mean percentages of live and dead cells are presented (B). US acoustic pressures of 0.6, 0.7 and 0.8 MPa were tested to increase CTG signal intensities in HUVECs after incubation of CTG for 30 min (C). Untreated condition was HUVEs after incubation of CTG for 30 min. After 2 h of post-USMB, HUVECs were harvested and measured using flow cytometry (C). The mean fluorescent intensities (MFI) of CTG were presented (C). As a control, HUVECs without CTG staining were used. MFI results presented are the mean of two independent experiments.

