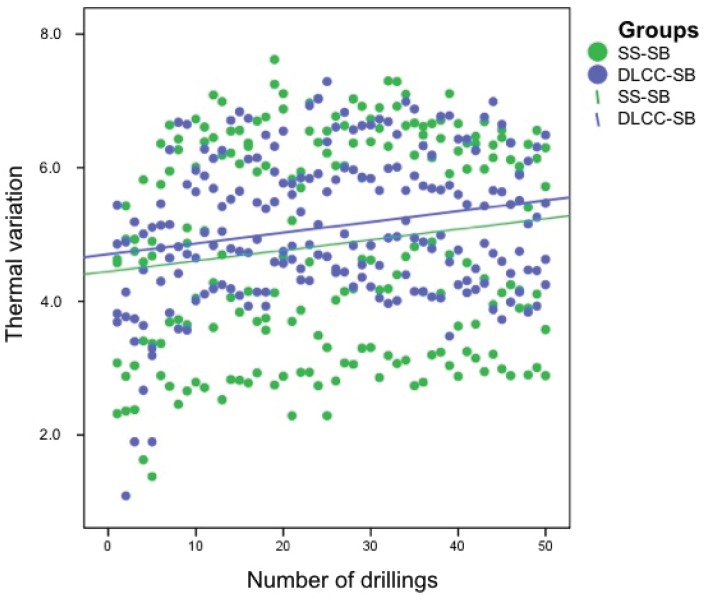
Figure 3.
Thermal evolution over 50 drillings for the drills of the SS-SB and DLCC-SB groups. The green dots represent the thermal variation of each drill of the SS-SB group, and the blue dots represent the thermal variation of each drill of the DLCC-SB group. The green and blue lines correspond to the SS-SB group and DLCC-SB group, respectively, and represent multiple linear regression models of the thermal evolution of these groups.

