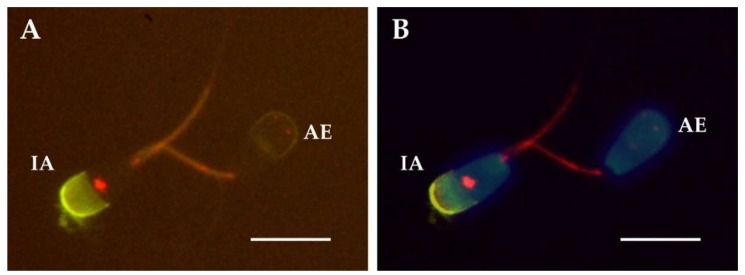
Figure 2.
Representative micrographs of the staining employing immunolabeling for the detection of PTP (red-orange) and PNA-FITC for the acrosome (green). (A) micrograph taken with a fluorescence filter for visualizing PNA-FITC (green) together with the staining of PTP (red-orange). (B) micrograph merged after taking pictures with three filters: for the visualization of the nuclei stained with Hoechst 33342 (blue), PNA-FITC (green) and the staining of PTP (red). Spermatozoon showing intact acrosome (IA) and the PTP staining pattern II and spermatozoa showing acrosomal exocytosis (AE) and the PTP staining pattern I. Scale bar represents 10 µm.

