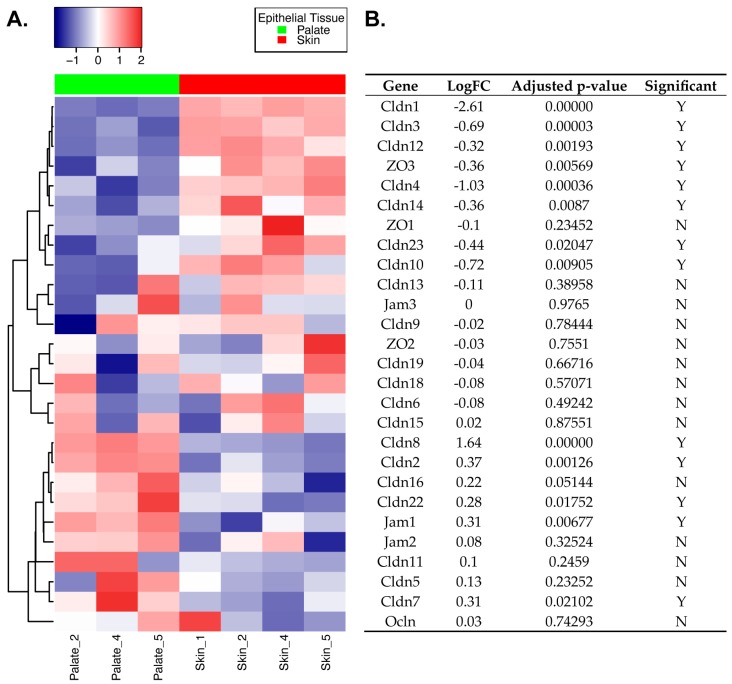
Figure 1.
Differential expression of tight junction molecules in primary mouse skin and oral epithelial cells. Skin epithelium obtained from the tails of mice were compared to oral epithelium obtained from the hard palate of mice using the R/Bioconductor package linear models for microarray data (limma). (A) Heatmap displaying gene expression profiles of the 27 tight junction (TJ) genes analyzed. Genes were hierarchically clustered using the Euclidean distance measure and complete clustering, with gene expression scaled across rows. Each row is a gene and each column is a sample. (B) Table of limma results for the corresponding 27 TJ genes analyzed. The gene column is aligned to match and annotate the corresponding heatmap in A (left). LogFC is the calculated log2 fold change between oral and skin epithelium, with positive values corresponding to over expression in palate and negative values corresponding to over expression in skin. Adjusted p-value is listed in the second column, and the third column identifies whether or not the gene was significantly differentially expressed (Y = yes, N = no) using an adjusted p-value of p < 0.05. n = 4 mice for skin and n = 3 mice for palate epithelium. Data from one of the palate samples (Palate_1) was excluded in this analysis due to its poor quality (see the Materials and Methods section).

