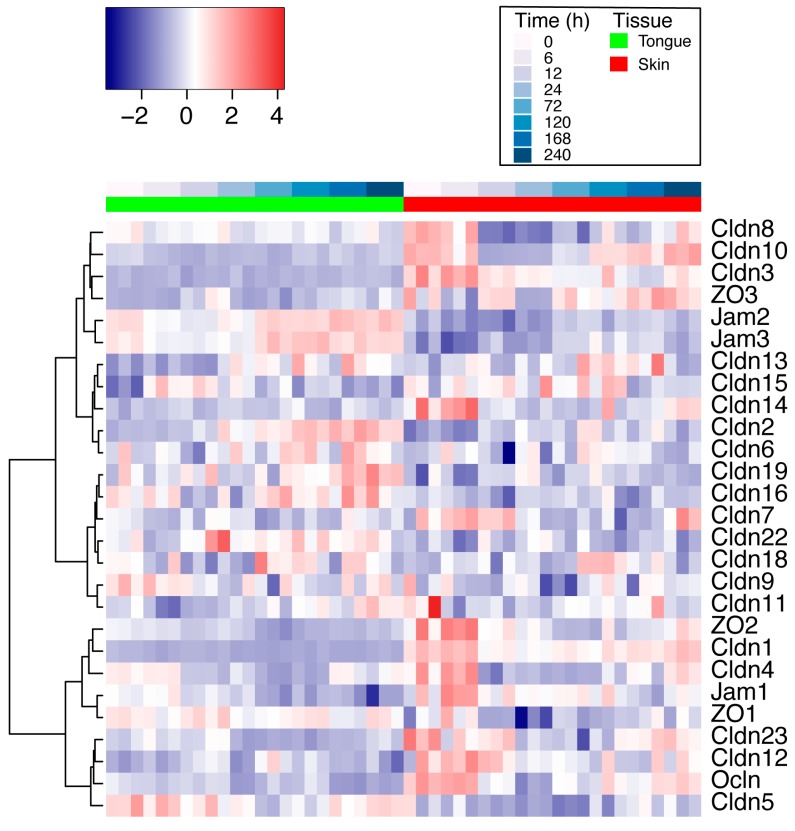
Figure 2.
Differential expression analysis of tight junction molecules in mouse skin and oral wounds in vivo. A heatmap displaying the gene expression profiles of the 27 TJ genes analyzed in response to wounding over 10 days in both skin and tongue wounds. Genes were hierarchically clustered using the Euclidean distance measure and complete clustering, with gene expression scaled across rows. Each row is a gene and each column is a sample at a specific time point. Time 0 represents baseline expression in normal tissue, and subsequent time points represent hours after wounding. Samples are displayed in response to injury over time, going left to right for each tissue using a white–blue color scale bar, with tissues denoted by green or red color bars. n = 3 mice per group per time point for both skin and oral wounds.

