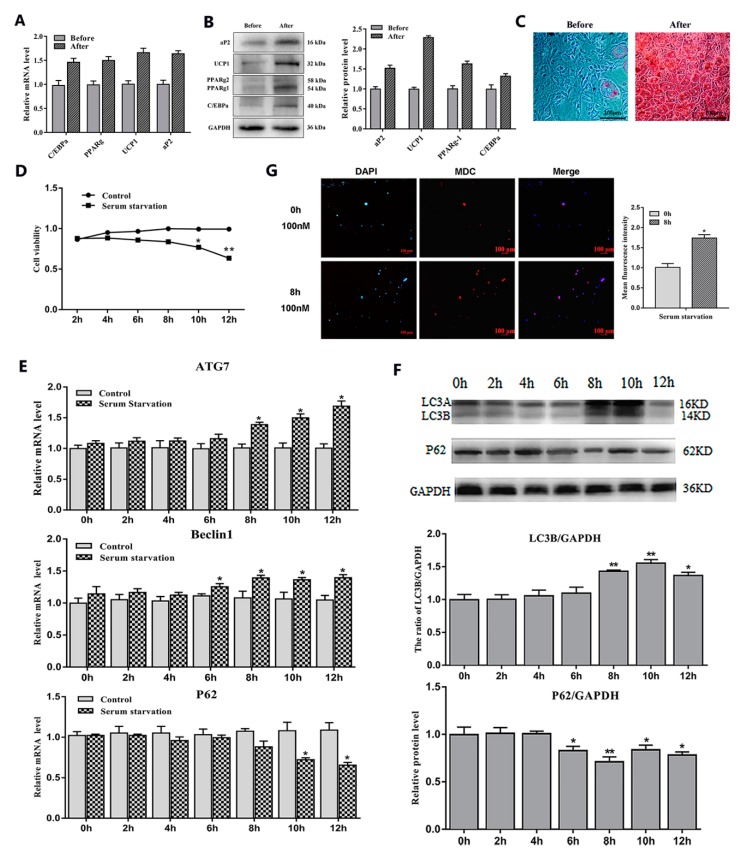
Figure 1.
Adipocytes autophagy was induced by serum starvation treatment. (A) Relative mRNA level of adipogenic differentiation-related genes (n = 6). (B) Protein level of adipogenic differentiation-related genes (n = 6). (C) Representative images of differentiated cells were labeled with Oil Red O (n = 6). (D) Cell viability was detected by bycholecystokinin-8 (CCK8) (n = 6). (E) Relative mRNA level of autophagy-related genes with or without serum starvation for different lengths of time (n = 6). (F) Protein level of autophagy-related genes with or without serum starvation for different lengths of time (n = 6). (G) Monodansylcadaverine (MDC) and DAPI staining by serum starvation treatment for 8 h. Values are means ± SD. vs. control group, * p < 0.05, ** p < 0.01

