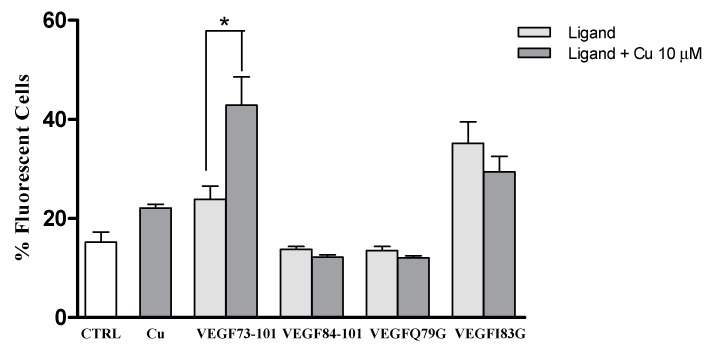
Figure 8.
Histograms showing the number of fluorescent cells, expressed as %, of the whole population treated with the above indicated FAM-conjugated peptides (500 nM) and FAM-peptides/copper complexes. Data are the mean ± SEM of three different experiments performed in triplicate. Statistically significant differences are indicated with * = p < 0.05 vs. CTRL (One-Way ANOVA + Tukey’s test).

