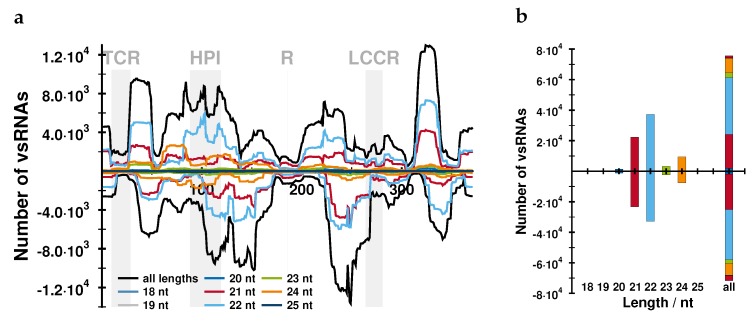
Figure 6.
Mapping of vd-sRNA to the AFCVd genome (a) and length distribution of vd-sRNA (b) in infected leaves. (a) The x-axis represents the AFCVd genome; the curves above the x-axis (positive numbers) represent the number of vd-sRNAs with (+) sequence, below (negative numbers) with (−) sequence. The sequence regions of TCR, hairpin I, right terminal hairpin and lower CCR are marked (cf. Figure 1). Mapping of small RNAs was performed with bowtie v1.1.2 [39] allowing for one mismatch. For comparison to data from pollen stages 3 and 5 and pollen tubes, see Figure S5.

