
Figure 3.
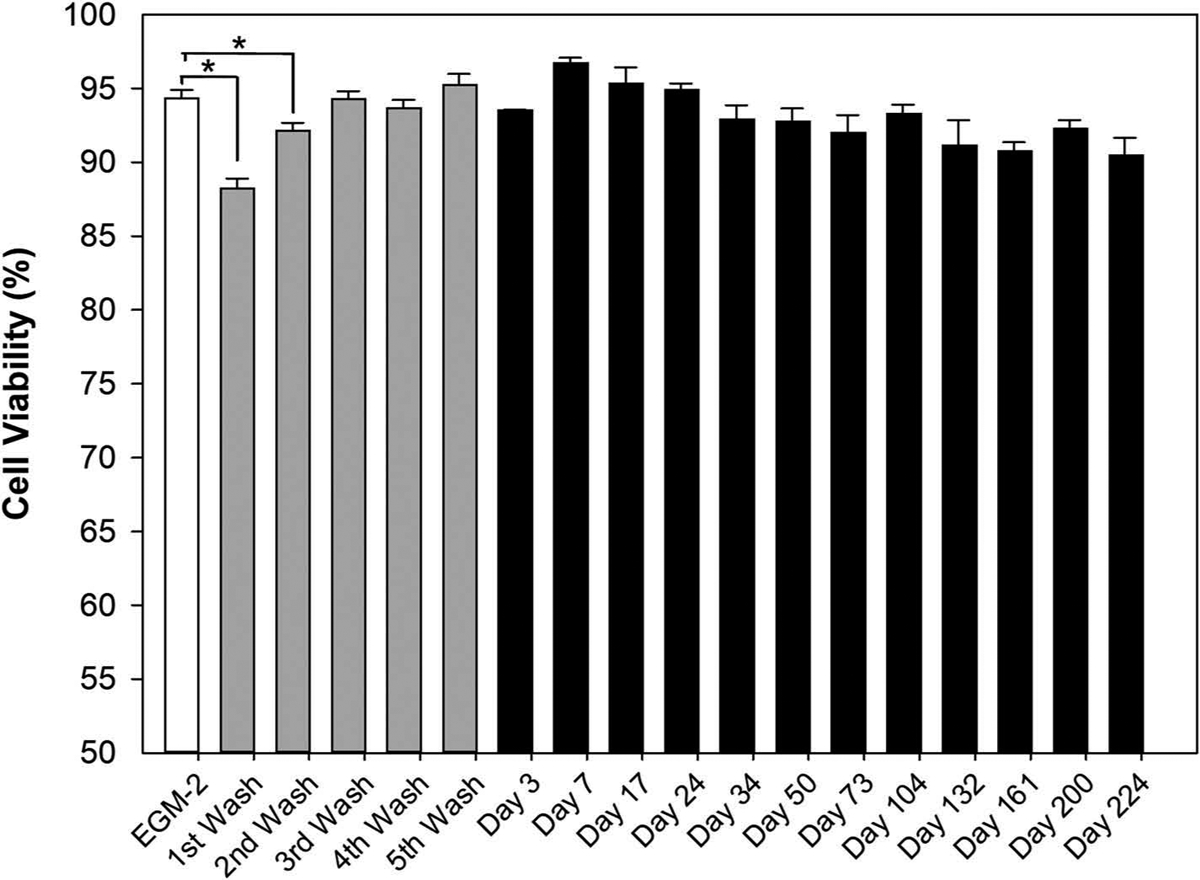
LIVE/DEAD cell viability results. The white bar represents cell viability from endothelial cell growth media-2 (EGM-2) as control; the gray bars stand for cell viability from five times washing buffer; and the black bars signifies cell viability from degraded buffer of 2 mM DDS-20 incubated under body temperature at corresponding time points. Error bars represents standard error (n = 3). And * indicates statistically significant difference between groups (p < 0.05).