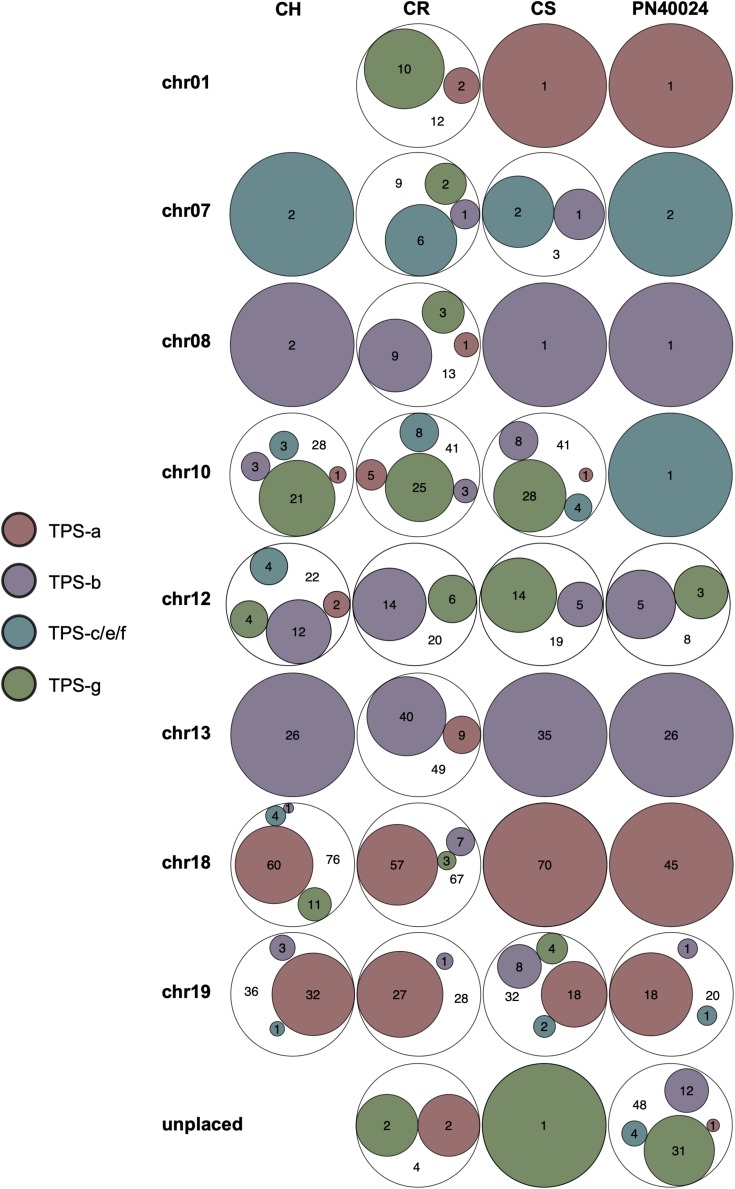
FIGURE 2.
Euler diagrams summarizing the chromosome specific distribution of VviTPS-subfamilies for each of the diploid genomes: Cabernet Sauvignon (CS), Carménère (CR), and Chardonnay (CH) as well as the Martin et al. (2010) annotation of PN40024 (PN). The legend shows the different VviTPS subfamilies, proportionally sized within the Euler diagrams to reflect the total number of VviTPS-like gene regions per cultivar and chromosome.

