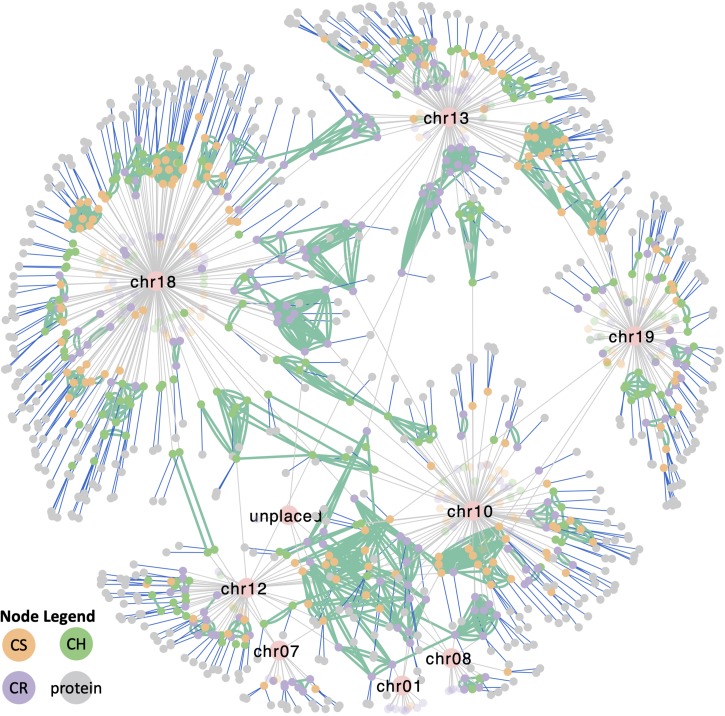
FIGURE 8.
Cytoscape network representing all metadata represented in Figures 2–7 of the respective VviTPS gene families for Cabernet Sauvignon (CS), Carménère (CR), and Chardonnay (CH). Nodes represent VviTPS genes, colored according to cultivar with the lighter shade showing partial genes. Gray edges show the chromosome mapping (pink nodes), with green edges showing genes with high homology (degree of similarity (I’) > 80%). Green edges connecting nodes of the same color reflect within cultivar homologs (i.e., duplicated genes) while edge connections between different colored nodes show cross-cultivar homologs. Blue edges show putative proteins associated with a gene (i.e., predicted to be functional). An interactive version of this network to access the metadata is available online.

