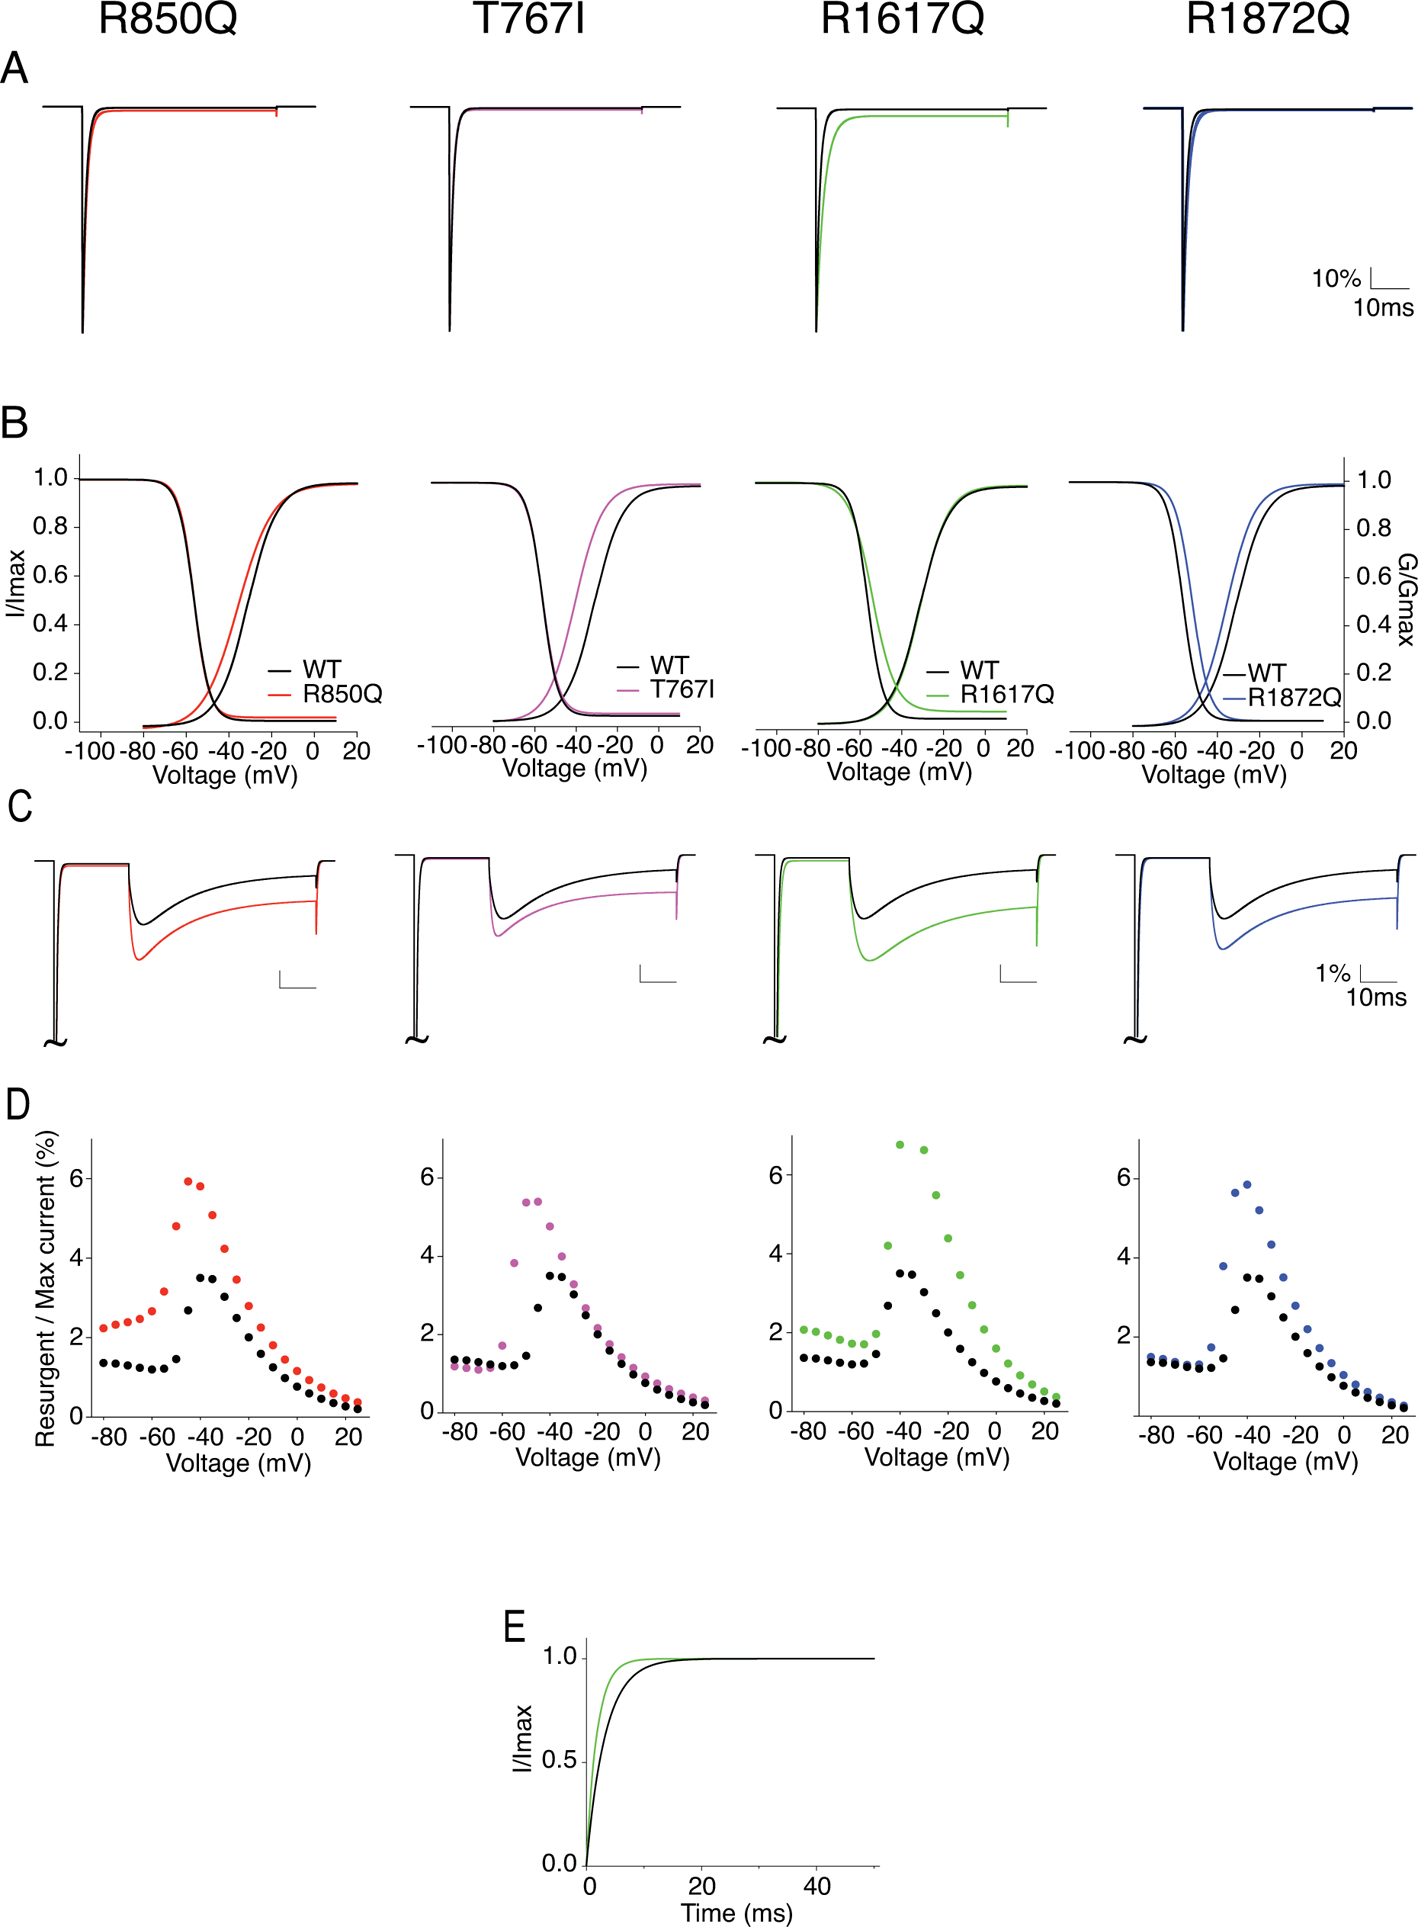
Figure 11. Simulation of sodium current generated by modeled WT and mutant Nav1.6.

A, example WT (black) and mutant Nav1.6 currents (red: R850Q, pink: T767I, green: R1617Q, blue: R1872Q) generated from modeled neurons without open channel block. B, I-V/G-V plots showing the voltage dependence of activation and steady-state inactivation of the modeled WT and mutant Nav1.6 channels. C, example resurgent currents generated by modeled WT and mutant Nav1.6 channels with open channel block. D, per cent resurgent currents plotted against repolarization voltages from simulated recordings. Peak resurgent currents were measured starting 1.4ms into the repolarization step and normalized to the maximum peak current during a 50ms activation protocol. E, recovery from inactivation plot with recovery time duration from 0 to 50ms for R1617Q. Values are reported in Table 3.
