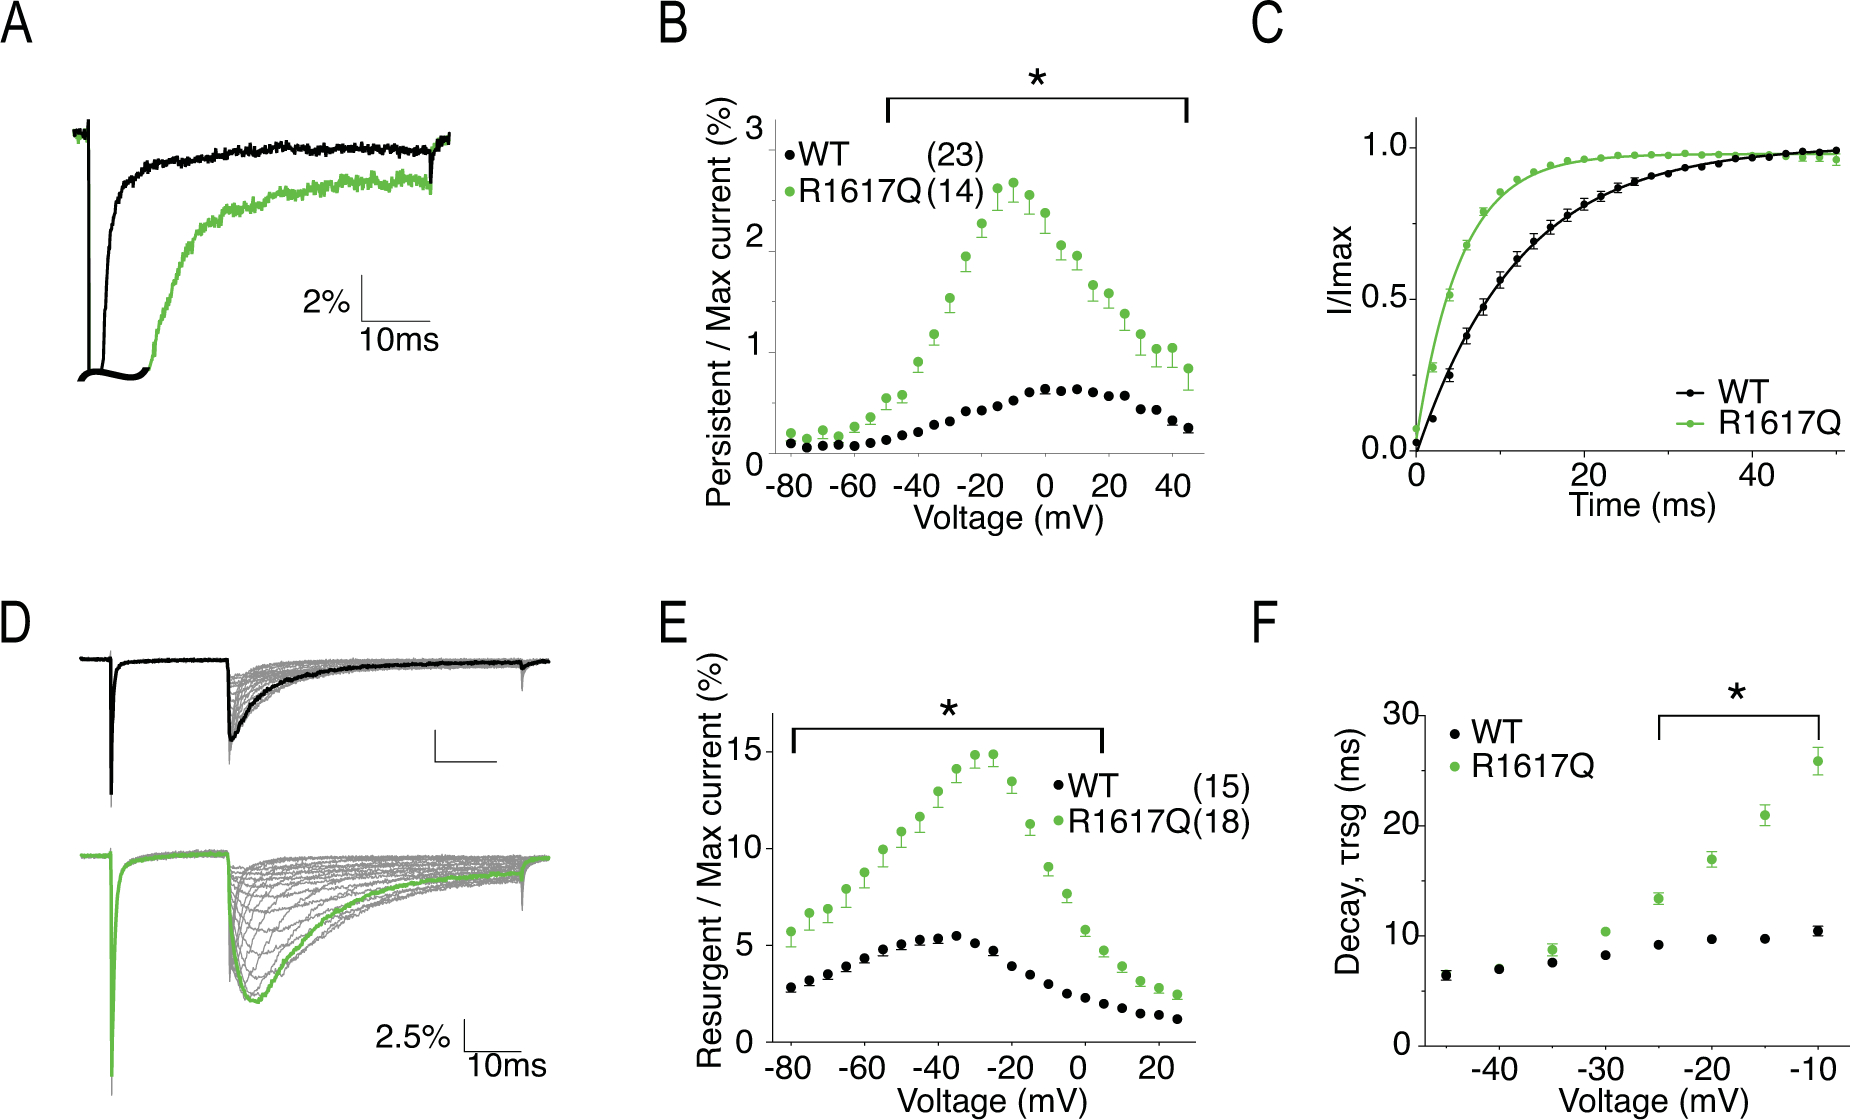
Figure 8. R1617Q has increased persistent current, faster recovery from inactivation, increased resurgent current and altered resurgent current kinetics.

A, representative traces showing persistent current from WT (black) and R1617Q (green) channels. Traces shown are elicited at 0mV and presented as the percentage amplitude normalized to the maximum peak current during the 50ms activation protocol. B, per cent persistent current-voltage plot with persistent current measured during the last 1ms of the 50ms activation protocol. P < 0.0001 from −40mV to 40mV in two-way ANOVA with Sidak multiple comparison test. C, recovery from inactivation with recovery time duration from 0 to 50ms. D, representative traces showing resurgent current from WT (top) and R1617Q (bottom) channels. E, per cent resurgent current plotted against repolarization voltage. P < 0.0001 from −75mV to 0mV in two-way ANOVA with Sidak multiple comparison test. F, Rate of decay for resurgent current (τrsg) at each repolarization voltages. P < 0.0001 from −25mV to −10mV in two-way ANOVA with Sidak multiple comparison test. All values and statistical significance are reported in Table1.
