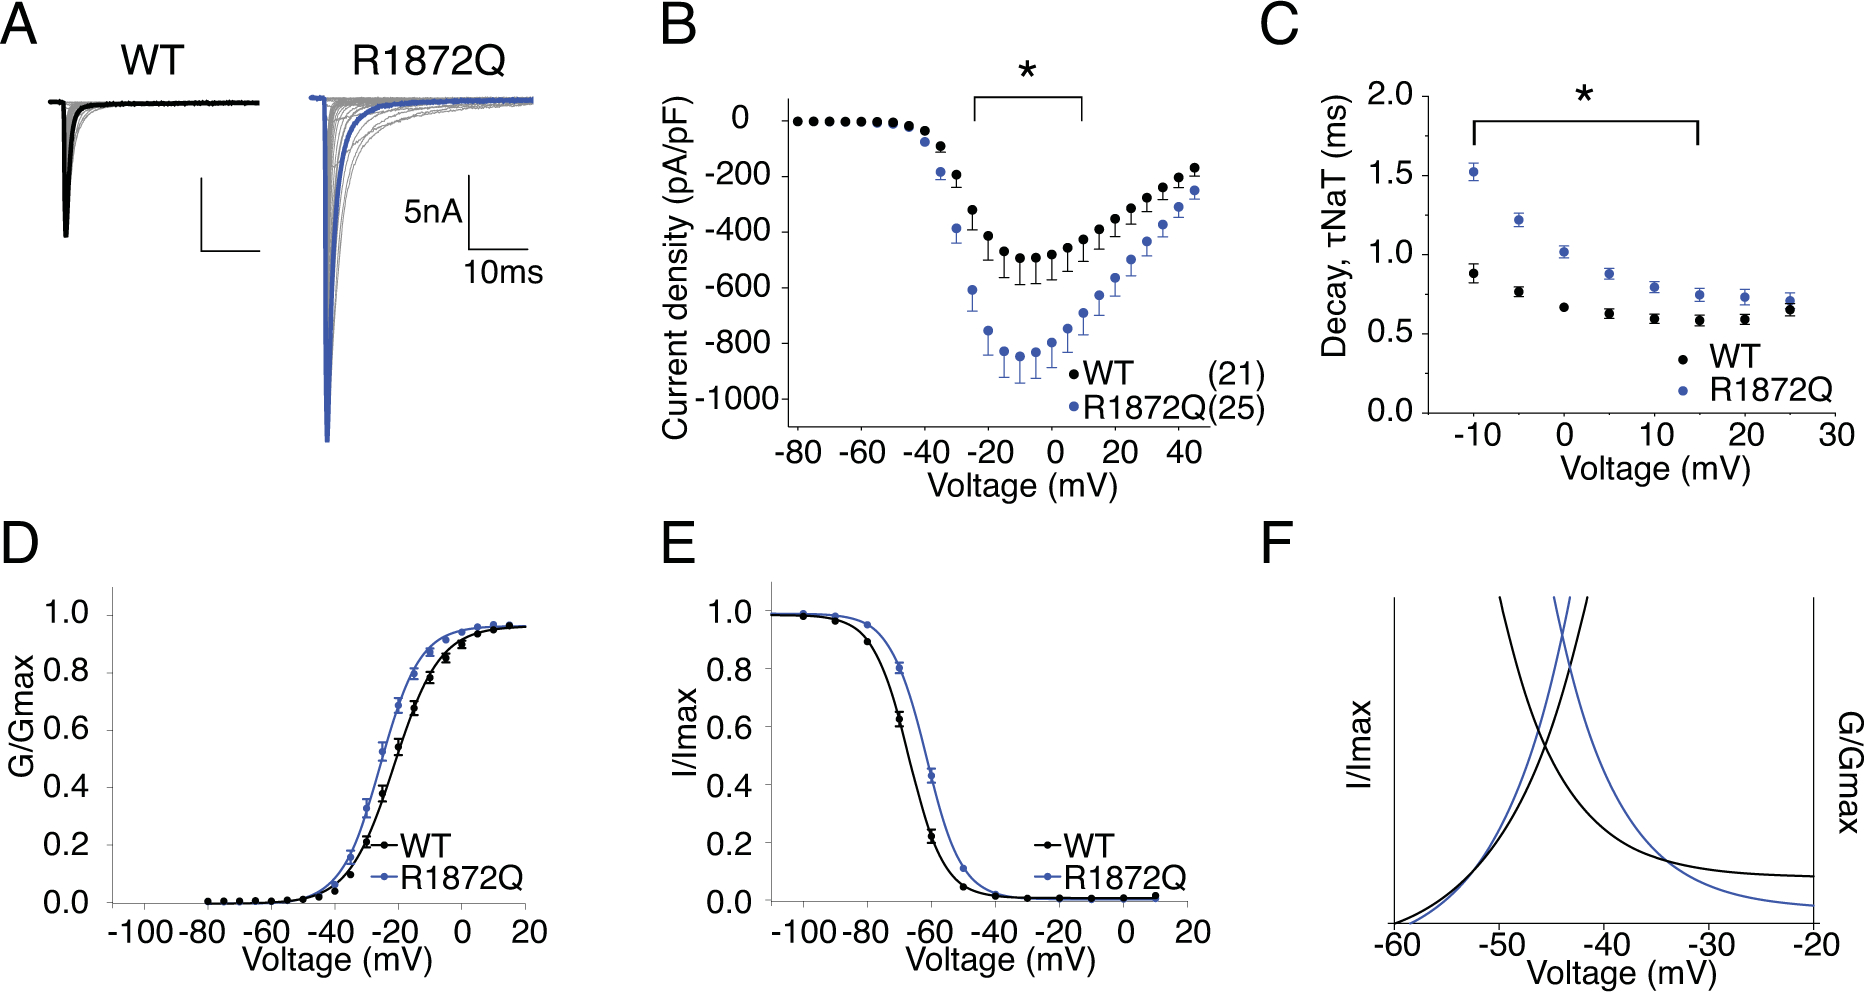
Figure 9. R1872Q has increased current amplitude, altered voltage-dependence of both activation and steady-state inactivation.

A, representative current trace families from hNav1.6 WT (left) and R1872Q (right) channels elicited by an activation protocol. Maximum current traces are highlighted with bolded black and blue respectively. B, Current density-voltage plot of hNav1.6 WT and R1872Q. P < 0.05 from −25mV to +10mV in two-way ANOVA with Sidak multiple comparison test. C, Rate of decay for transient sodium current (τNaT) at each depolarization voltages. P < 0.0001 from −10mV to 0mV in two-way ANOVA with Sidak multiple comparison test. D,E, activation and steady-state inactivation curves fitted with Boltzmann functions. F, window currents shown by Boltzmann fitted curves enlarged from DE combined. All values and statistical significance are reported in Table1.
