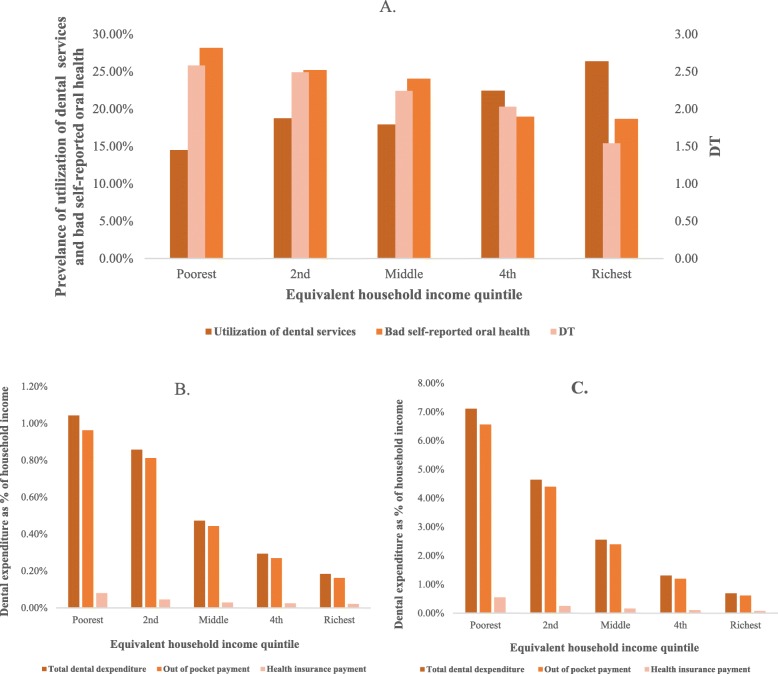
Fig. 2.
Dental expenditure, dental care and dental needs in different household income groups. a Different distributions of dental care and needs in household income groups from poor to rich. The utilization of dental service in the past year indicated the dental care, the DT and the bad self-reported oral health indicated evaluated and subjective dental needs, respectively. b Different payments routes as percentage of household income for all participants—averaged by household income quintile. c Different payment routes as percentage of household income for those who used dental services in the past year—averaged by household income quintile

