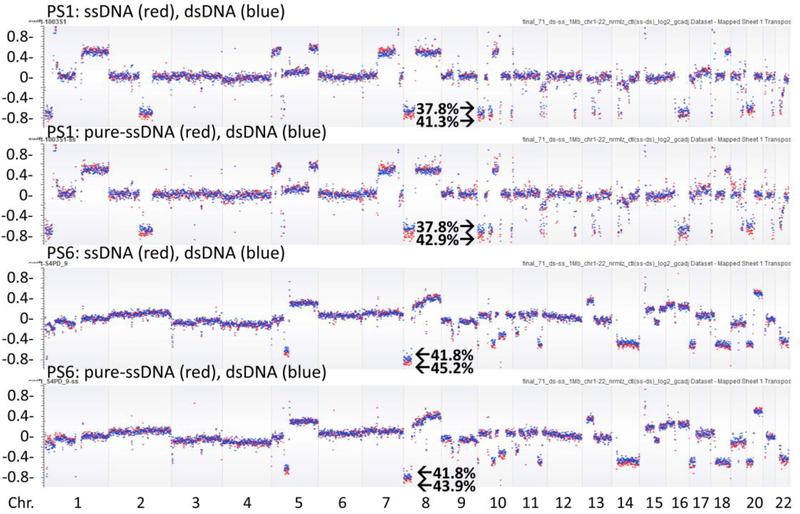
Fig. 4.
Copy number change across the genome in different libraries. Copy number changes (log2 values) were clearly separated between ssDNA libraries or pure-ssDNA libraries (red dots) and their matched dsDNA libraries (blue dots). ctDNA content was higher in ssDNA libraries or pure-ssDNA libraries than dsDNA libraries. Segment deletions in chromosome 10p (in PS1) and 8p (in PS6) were used for ctDNA content calculation (ctDNA percentage indicated). The x axis indicated the chromosomes and the y axis indicated the log2 copy number values

