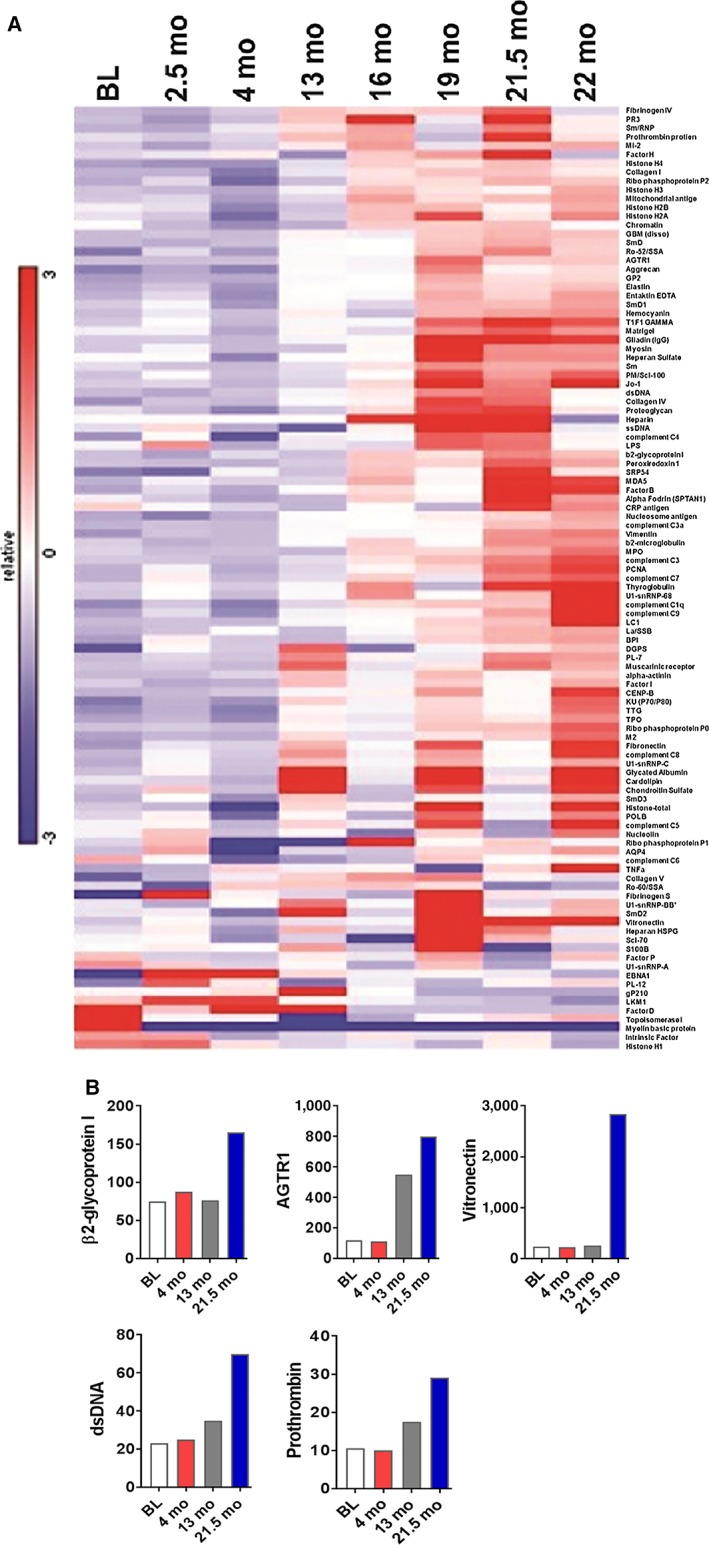
Figure 2.

Longitudinal autoantibody analysis. (A): Heatmap of 124 autoantibodies at eight time points. (B): Serum levels of selected autoantibodies associated with Raynaud's phenomenon over time. At BL, 4 months, 13 months, and 21.5 months (shortly before development of clinical features of Raynaud's). Values on y‐axis represent net fluorescence intensity as described in methods. Abbreviations: BL, baseline; dsDNA, double‐stranded DNA; mo, months.
