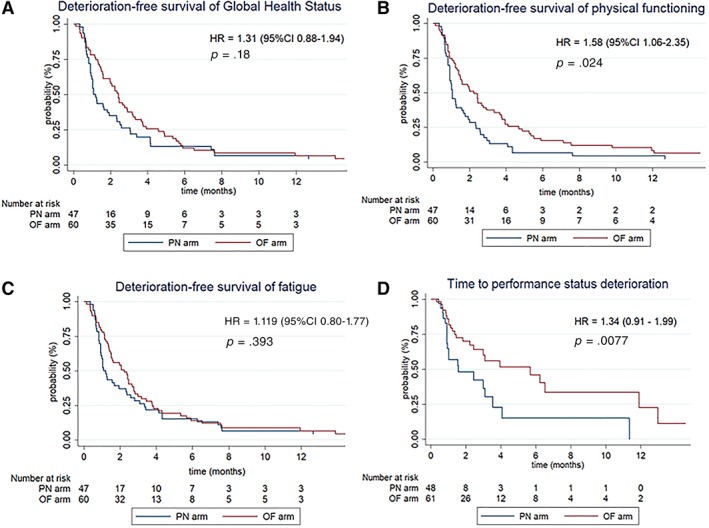
Figure 2.

Kaplan‐Meier curves of health‐related quality of life deterioration‐free survival for the three target dimensions and time to performance status deterioration.Abbreviations: CI, confidence interval; HR, hazard ratio; OF, oral feeding; PN, parenteral nutrition.
