Fig. 4.
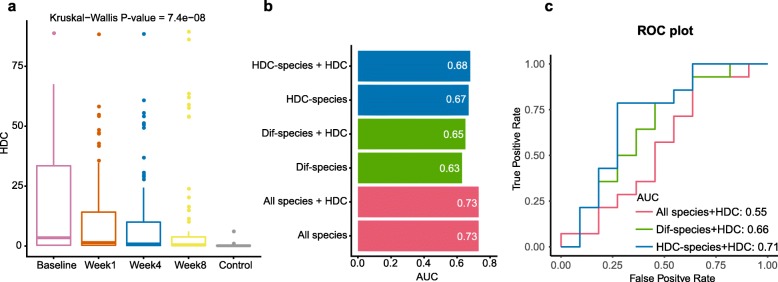
HDCs were reduced during treatment, and could improve the performance of machine learning models in predicting treatment response of CD patients. a, HDCs were significantly reduced along treatment intervention. b, Predictive results as AUC values obtained from 10-time repeated 10-fold cross-validation models for classifying treatment response. The labels of y-axis mean the features used for building models. HDC-species: HDC-correlated species in untreated patients and controls (see Methods for details); Dif-species: species whose abundances are significantly different between untreated patients and controls (Wilcoxon Rank Sum Test, see Methods); All-species: the overall species. c, External validation of models based on HDC and species showing in Fig. 4b. Accuracies were displayed as ROC plot, in which x axis is false positive rate, y axis is true positive rate, and AUC is the area under the curve

