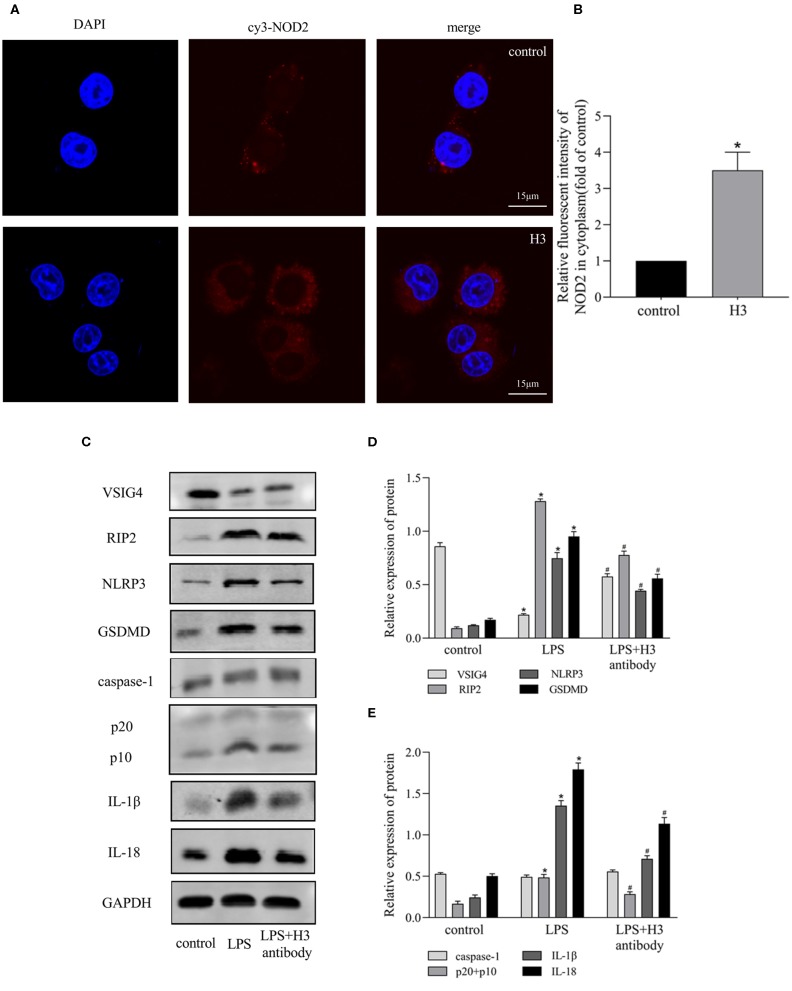
Figure 3.
Effects of Histone H3 antibody on LPS-induced NOD2 and VSIG4 signal transduction in vitro. Cells were treated the same way as Figure 2. (A,B) Immunofluorescence was used to detect the expression of NOD2 in cytoplasm. Relative fluorescent intensity of NOD2 in cytoplasm was presented as mean ± SDs of three independent experiments. (C–E) The protein levels of RIP2, VSIG4, NLRP3, caspase-1, GSDMD, IL-1β, IL-18 in ANA-1 cells. Results were presented as mean ± SDs of three repetitions. *P < 0.05, compared with control group; #P < 0.05, compared with LPS group.

