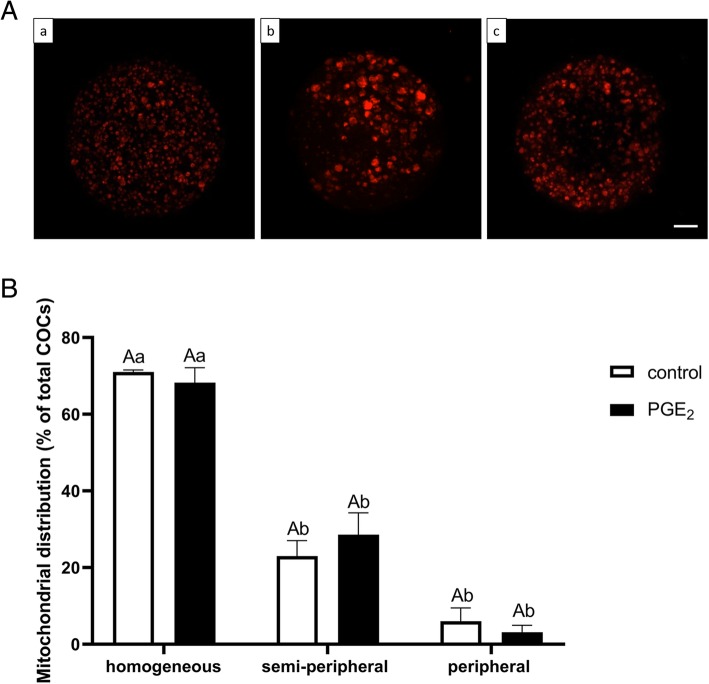
Fig. 4.
The effect of PGE2 (10 μM) on mitochondrial distribution pattern in bovine oocytes after IVM. Panel (A) depicts representative fluorescent images of mitochondrial (a) homogeneous, (b) semi-peripheral, and (c) peripheral distribution in bovine oocytes after IVM. Bars = 25 μm. Panel (B) depicts quantitative analysis of PGE2 effect on mitochondrial distribution pattern. The values are presented as percentage of COCs and expressed as mean ± SEM of three independent repeats (25 COCs per treatment group). Capital letters indicate statistical significance (P > 0.05) between two treatments whilst different small letters indicate significant differences (P < 0.05) within each treatment, as determined by two-way ANOVA followed by the Tukey multiple comparison test

