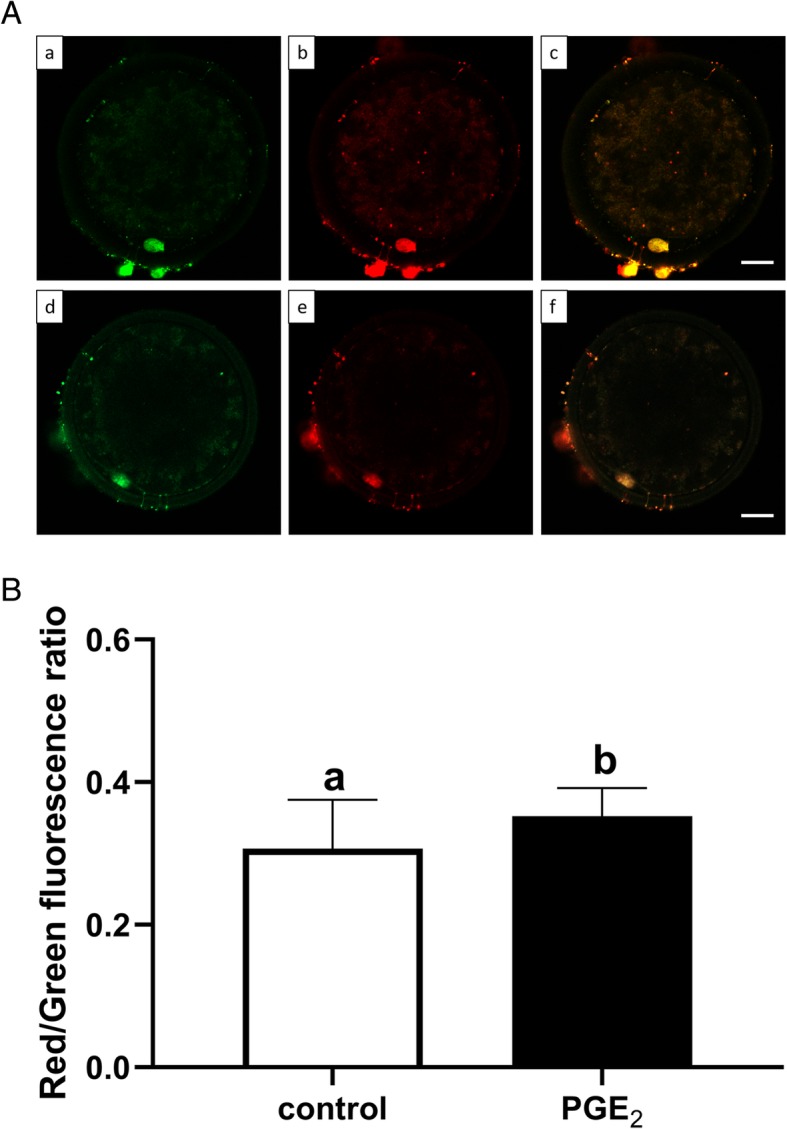
Fig. 5.

The effect of PGE2 (10 μM) on mitochondrial membrane potential (MMP) in bovine oocytes after IVM. Panel (A) depicts representative fluorescent images of oocytes with high (a-c) or low (d-f) polarization of mitochondria as detected by the JC-1 dye (a, d – green; b, e – red; c, f – merge fluorescence). Bars = 25 μm. Panel (B) depicts quantitative analysis of PGE2 effect on mitochondrial membrane potential. The values are presented as the ratio of red fluorescence intensity to green fluorescence intensity and expressed as mean ± SEM of three independent repeats (25 COCs per treatment group). Different letters indicate significant differences (P < 0.05), as determined by Student’s t-test
