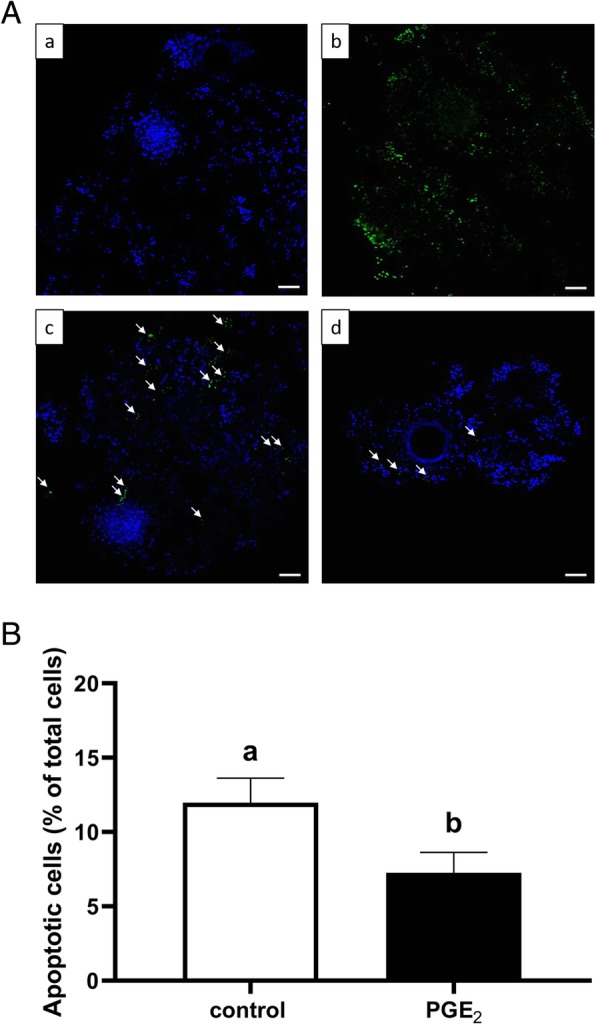
Fig. 7.

The effect of PGE2 (10 μM) treatment of oocyte maturation medium on apoptosis in COCs. Panel (A) depicts representative fluorescent images of bovine COCs used to TUNEL labeling: (a) negative control, (b) positive control, (c) control COCs, and (d) COCs matured in the presence of PGE2. White arrows indicate TUNEL stained apoptotic nuclei (green) in contrast to DAPI stained nuclei (blue). Bars = 100 μm. Panel (B) depicts quantitative analysis of PGE2 effect on apoptosis in COCs. The data are presented as a percentage of TUNEL positive apoptotic cells within all detected DAPI positive cells and expressed as mean ± SEM of three independent repeats (25 COCs per treatment group). Different letters indicate significant differences (P < 0.05), as determined by Student’s t-test
