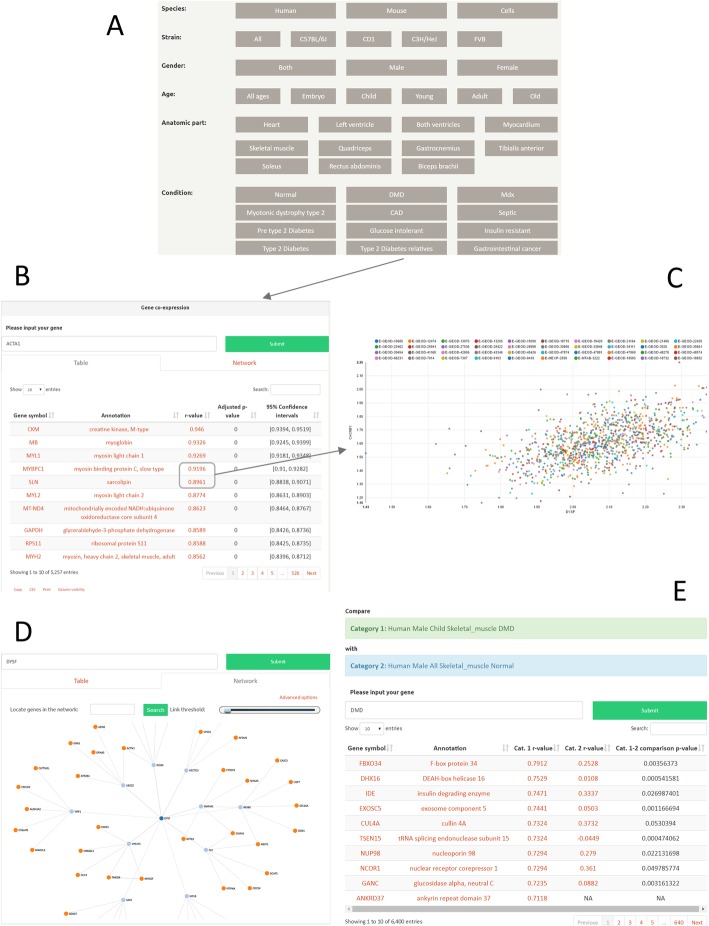
Fig. 2.
How to browse MyoMiner. aSelect a category of interest. All categories are visible at the beginning, so that the user can find with ease what is available on MyoMiner. By clicking a category only the options that are related with this category will remain visible. This way the user is guided to the available MyoMiner categories. bTable output. Search by gene symbol, Ensembl or Entrez gene ID. All transcriptional co-expressions of any expressed gene-pair displayed when hitting submit. The first column is the paired gene symbol, the second is the annotation of the paired gene, the third is the Sprearman’s correlation of that pair, the fourth and fifth are the BH FDR adjusted p-value and the confidence intervals. The table can be downloaded in CSV format or copied directly to the clipboard cGene pair scatterplot. The expression values of every sample of the selected category for that gene pair are plotted by clicking on the r value. Each series is shown at the top and can be toggled to display the expression values for any series independently. dCorrelation network. The network is constructed based on gene correlation. Users can change the number of relations or set a correlation threshold from the advanced options. eDifferential co-expression analysis. Select two or more categories and compare the first to the rest. A gene may be a regulator if its co-expression is significantly altered (p-value) between pathological conditions. MyoMiner can be accessed at https://www.sys-myo.com/myominer

