Fig. 3.
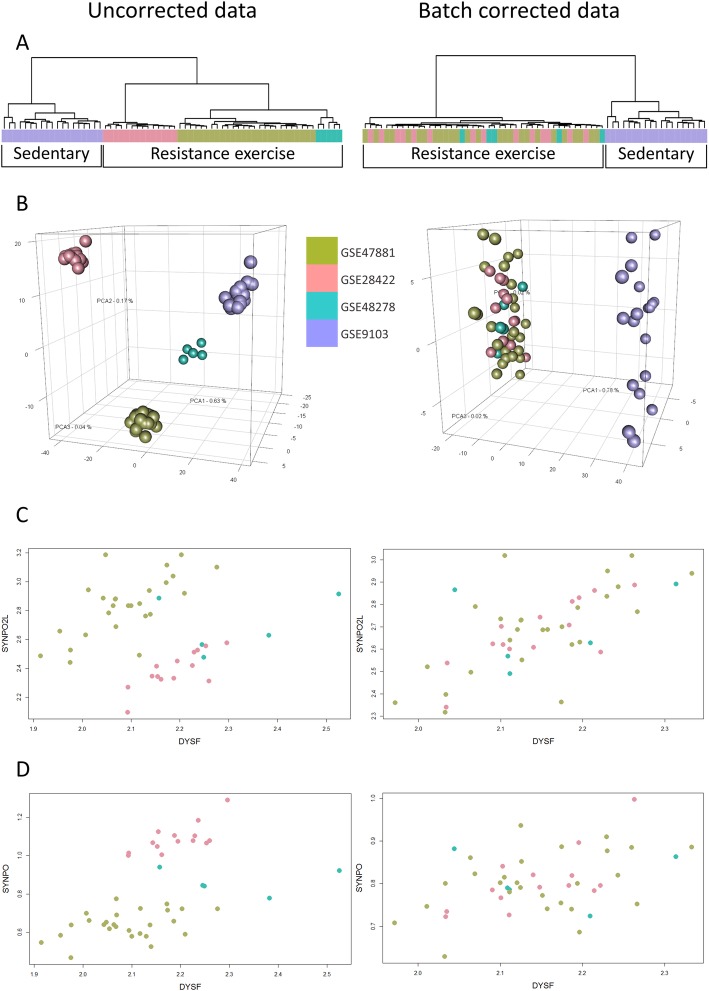
Example of batch effects treatment. The adult human quadriceps resistance exercise category is constructed from three series: GSE47881 (olive green), GSE28422 (pink) and GSE48278 (turquoise) that include 45 samples in total. GSE9103 (magenta) series, from sedentary individuals, is used as a visual control. On the left, one can see the untreated samples and on the right the batch-treated samples, using each series as a surrogate. a Hierarchical clustering of both resistance exercise and sedentary samples shows a clear separation. Note that resistance exercise samples are clustered by their corresponding series even after pre-processing (normalization). After treating the samples with ComBat, the resistance exercise samples are now mixed, reducing the batch effect. b Principal component analysis plots of the same samples. In the untreated plot, samples are clustered very well by their series (olive green, pink and turquoise). However, the resistance exercise series are as far from each other as the sedentary (visual control in this case) series. After the batch correction (right) all resistance exercise samples are clustered together and are clearly separated from the sedentary samples cluster. c The expression values of DYSF and SYNPO2L are grouped by series resulting in a correlation value r = − 0.05. After batch correction the samples are mixed with ρ = 0.62. d Inversely, in the example of DYSF and SYNPO where the ρ value is artificially high, before the treatment (ρ = 0.62), the correction reduces it to ρ = 0.36

