Fig. 2.
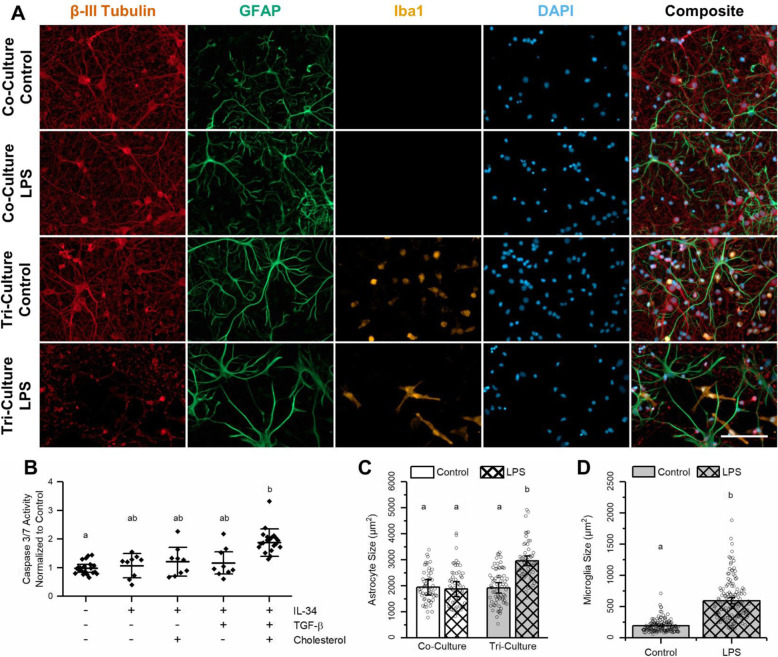
Comparing the effect of LPS on the co- and tri-culture models. Comparison of the effect of a 48-h exposure to 5 μM LPS on the co- and tri-cultures. a Representative fluorescence images of the tri- and co-cultures after a 48-h incubation with 5 μM LPS or vehicle. The cultures were immunostained for the three cell types of interest: neurons—anti-βIII-tubulin (red), astrocytes—anti-GFAP (green), microglia—anti-Iba1 (orange), and the general nuclear stain DAPI (blue). Scale bar = 100 μM. b Comparing the effects on apoptosis following a 48-h incubation with 5 μM LPS on DIV 7 cortical cultures maintained in different media types (mean ± SD, n = 3–6). c A comparison of the average astrocyte area from different conditions (mean ± SD, n = 3). d Comparing the average microglia size in tri-cultures exposed to LPS vs. vehicle (mean ± SD, n = 3). b–d The letters above the bars indicate statistically distinct groups (p < 0.05), while the points indicate the values of the technical replicates

