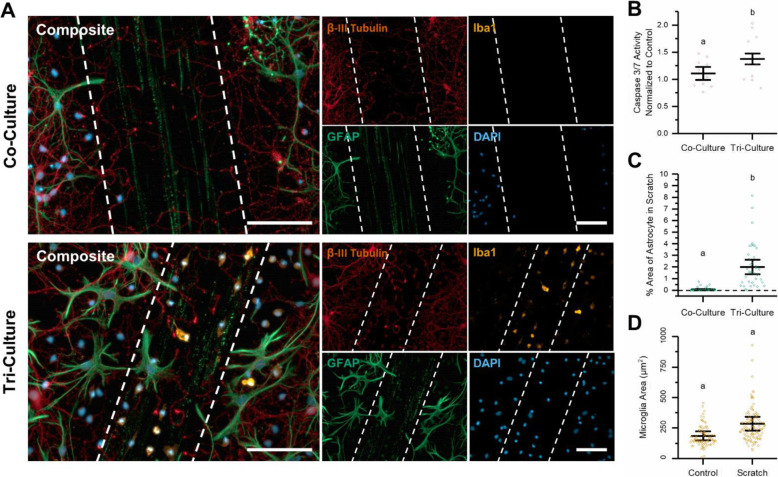
Fig. 3.
Response to mechanical injury. Comparing the effects from a simulated mechanical trauma (scratch) on co- and tri-cultures. a Representative fluorescence images of the co- and tri-cultures at 48 h following the simulated mechanical trauma. The dashed lines in the image highlight the area that was damaged by the scratch. The cultures were immunostained for the three cell types of interest: neurons—anti-βIII-tubulin (red), astrocytes—anti-GFAP (green), microglia—anti-Iba1 (orange), and the general nuclear stain DAPI (blue). Scale bar = 100 μM. b There was a significant increase in caspase 3/7 activity in the tri-culture as compared to the co-culture 48 h after the simulated mechanical trauma. c Comparing the percent area coverage of astrocytes in the scratched area between the co- and tri-cultures 48 h following the scratch. d Difference in the microglia area in the control and scratched tri-cultures. b–d All graphs display mean ± SD (n = 3), while the points indicate the values of the technical replicates. The letters above the bars indicate statistically significant differences (p < 0.05) as found by a t test assuming unequal variances

