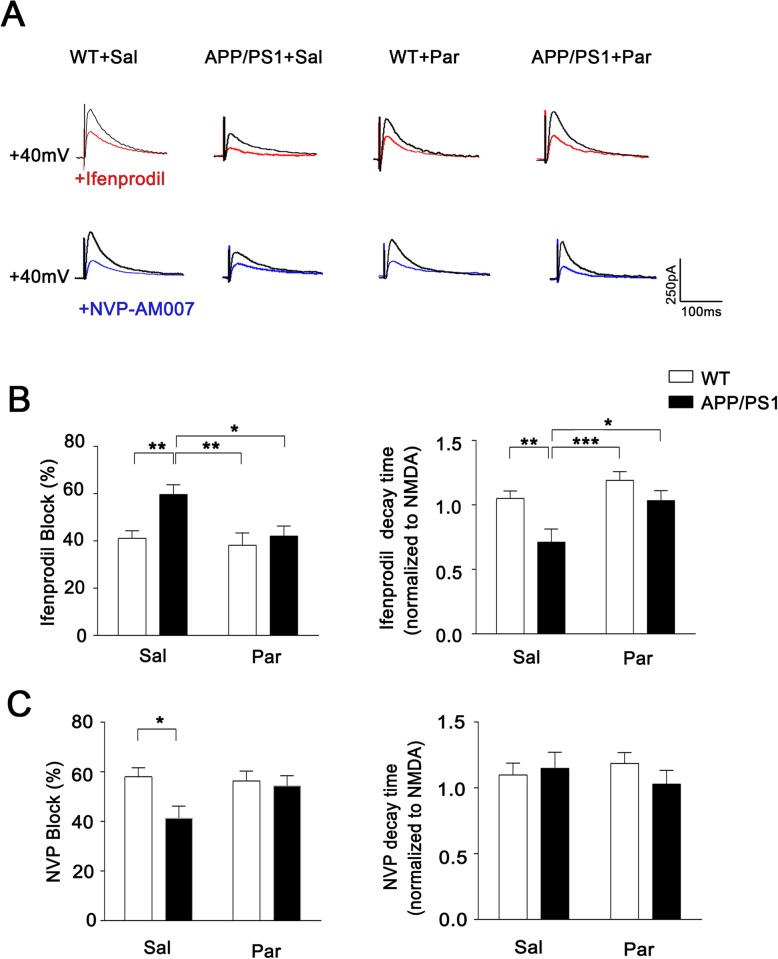
Fig. 4.
The GluN2A restoration in APP/PS1 after Paroxetine treatment according to NMDAR-mediated synaptic current. a Representative traces of NMDAR EPSC recorded at +40mv (black) and in the presence of ifenprodil (red) or NVP-AAM007 (blue). b Effect of ifenprodil application on NMDAR EPSC amplitude and decay time constant. c Effect of NVP application on NMDAR EPSC amplitude and decay time constant. Scale bar: 250pA (vertical) × 100 ms (horizontal). n = 12–20 neurons from 3 to 5 mice for per group. The data of decay time is normalized to the NMDA. Data are presented as mean ± SEM. * P < 0.05; ** P < 0.01; *** P < 0.001; two-way ANOVA with Sidak’s multiple comparison post hoc test

