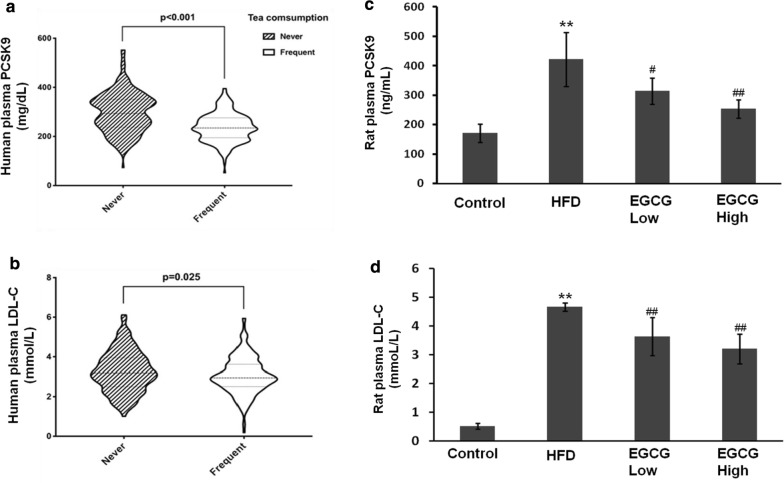
Fig. 1.
Change in circulating PCSK9 and LDL-C concentrations in human and in HFD rats. Comparisons of PCSK9 (a) and LDL-C (b) levels between tea drinker and non-tea drinkers by violin plot analysis. The vertical position of each histogram represents the relative levels of PCSK9 or LDL-C. SD rats fed with HFD for 4 weeks and administered with EGCG by i.g. at different doses for another 4 weeks. c The levels of plasma PCSK9 were analyzed by ELISA kit. d LDL-C lipid levels measured by biochemical kit. **p < 0.01, vs control, ##p < 0.01, versus HFD group (N = 6)

