Fig. 3.
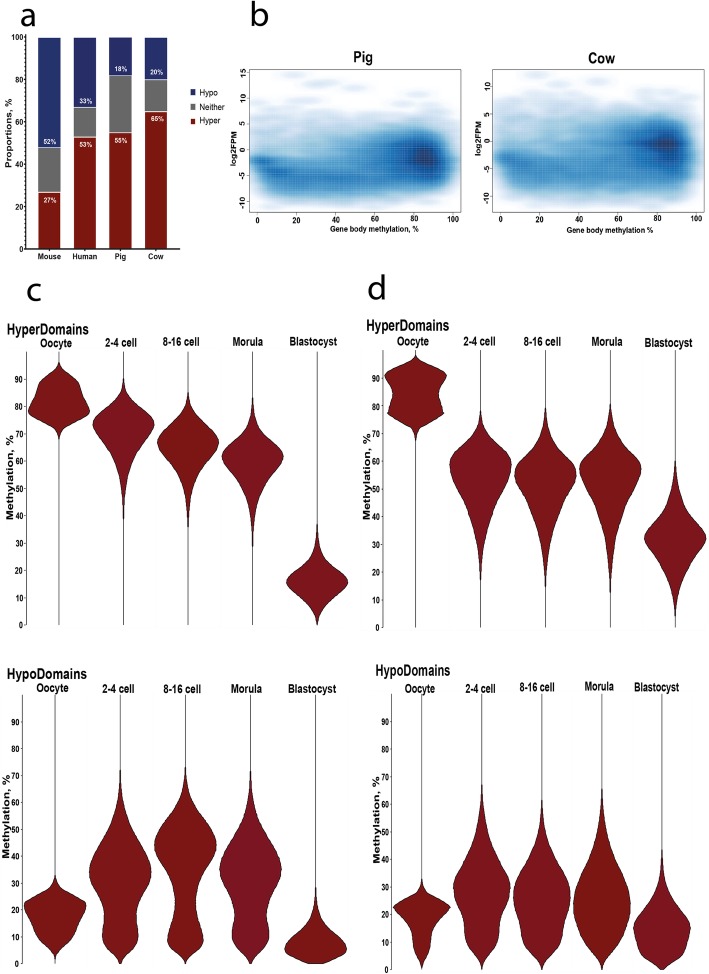
Properties of hyper- and hypomethylated domains in pig and cow. a Stacked bar chart of the percentage genome coverage of hypermethylated domains (HyperDomains; ≥ 75% methylation) and hypomethylated (HypoDomains; ≤ 25%) in oocytes from pig, cow, mouse and human. b Correlation between gene body methylation and gene expression in pig and cow oocytes. c Violin plots showing distribution of DNA methylation values (%) of oocyte HyperDomains and HypoDomains across the indicated stages in pig (c) and cow (d). The data in c are based on 55380 HyperDomains and 54959 HypoDomains and in d on 40453 HyperDomains and 57969 HypoDomains

