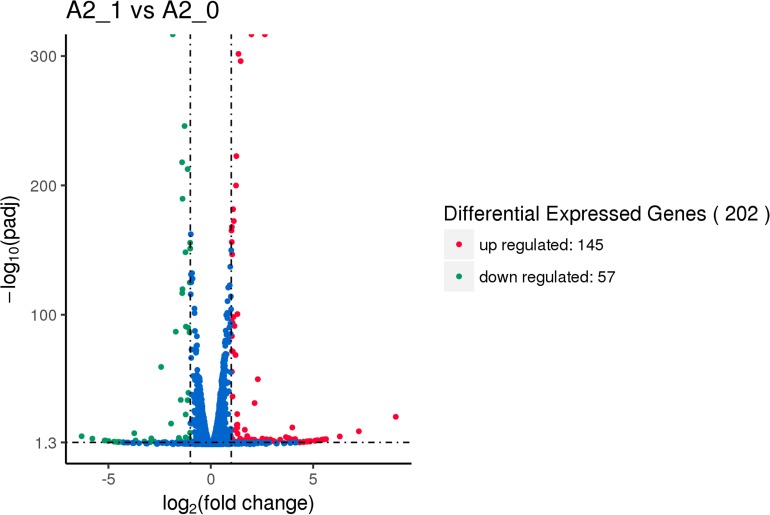
FIGURE 5.
Volcano map of differential expression genes between the experimental group [with 206.3 mT static magnetic field (SMF)] and control (without SMF). Significant differential expression genes are shown as a red (up) or green (down) dot. Non-significant difference between the expressions of genes is shown as a blue dot. Abscissa represents multiple genes expressed in different samples. Ordinate represents the magnitude of gene expression changes.

