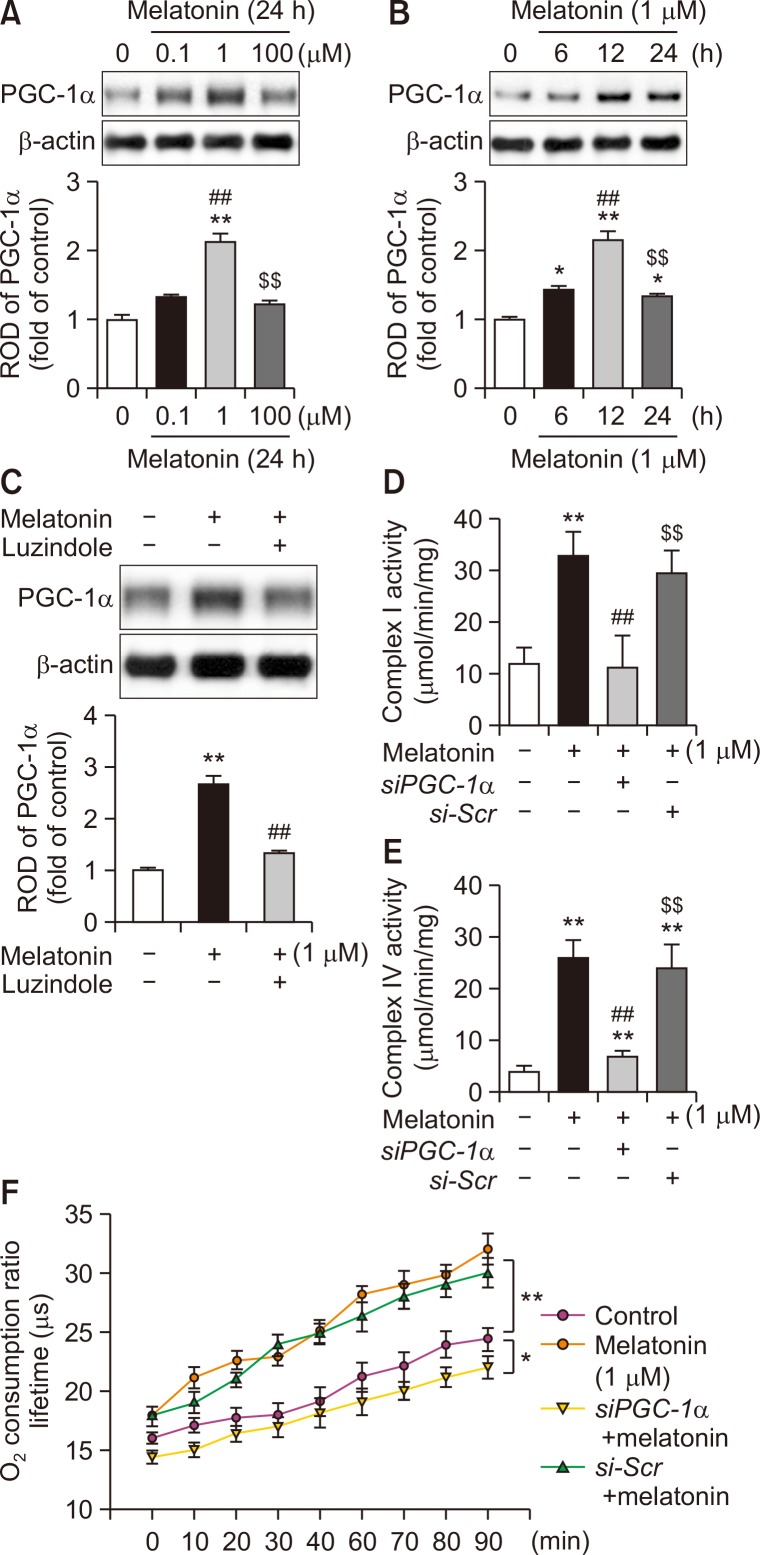
Fig. 1.
Effect of melatonin on PGC-1α-dependent mitochondrial oxidative phosphorylation in MSCs. (A) Expression of PGC-1α after treatment of MSCs with melatonin (0, 0.1, 1, and 100 μM) for 24 h. The expression level of PGC-1α was determined by densitometry relative to β-actin expression. Values represent the mean ± SEM. **p<0.01 vs. control, ##p<0.01 vs. MSCs treated with melatonin (0.1 μM), and $$p<0.01 vs. MSCs treated with melatonin (1 μM). (B) Expression of PGC-1α after treatment of MSCs with melatonin (1 μM) for 0, 6, 12, or 24 h. The expression level of PGC-1α was determined by densitometry relative to β-actin expression. Values represent the mean ± SEM. *p<0.05, **p<0.01 vs. control; ##p<0.01 vs. MSCs treated with melatonin for 6 h; $$p<0.01 vs. MSCs treated with melatonin for 12 h. (C) After pretreatment with luzindole (melatonin antagonist), the expression of PGC-1α in MSCs treated with melatonin (1 μM) for 12 h was determined by densitometry relative to β-actin expression. Values represent the mean ± SEM. **p<0.01 vs. control; ##p<0.01 vs. MSCs treated with melatonin alone. (D, E) Activities of mitochondrial complex I and IV in MSCs treated with melatonin. Values represent the mean ± SEM. **p<0.01 vs. control; ##p<0.01 vs. MSCs+melatonin; $$p<0.01 vs. MSCs+melatonin+siPGC-1α. (F) Mitochondrial OCR in MSCs treated with melatonin. Values represent the mean ± SEM. *p<0.05 and **p<0.01.

