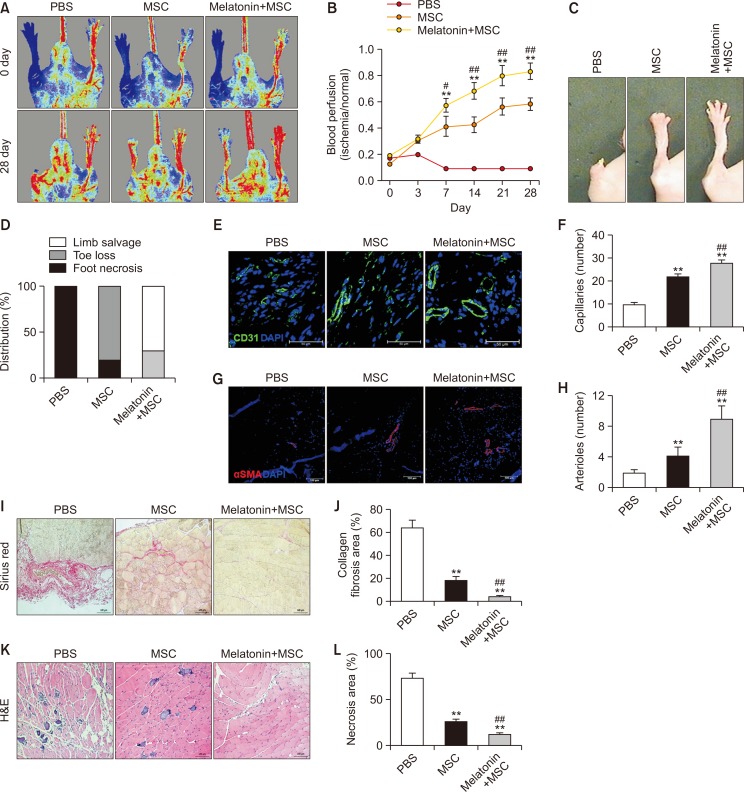
Fig. 6.
Assessment of functional recovery in a murine hindlimb ischemia model. (A) Blood perfusion by laser Doppler perfusion imaging in a murine hindlimb ischemia model transplanted with PBS, MSCs, and MSCs treated with melatonin. (B) Blood perfusion ratios. Values represent the mean ± SEM. **p<0.01 vs. PBS; #p<0.05, ##p<0.01 vs. MSCs. (C) Representative images illustrating various experimental outcomes (limb salvage, toe loss, and foot necrosis) in ischemic limbs at 28 days post operation. (D) Distribution of different outcomes at 28 days post operation. (E) Immunofluorescence staining for CD31 (green) in ischemic limbs at 28 days post operation. Scale bar=50 μm. (F) Standard quantification of capillary density represented as the number of CD31-positive cells. Values represent the mean ± SEM. **p<0.01 vs. PBS; ##p<0.01 vs. MSCs. (G) Immunofluorescence staining for α-SMA (red) in ischemic limbs at 28 days post operation. Scale bar=50 μm. (H) Standard quantification of arteriole density represented as the number of CD31-positive cells. Values represent the mean ± SEM. **p<0.01 vs. PBS; ##p<0.01 vs. MSCs. (I) Sirius red staining to evaluate collagen fibers in ischemic limbs at 28 days post operation. Scale bar=100 μm. (J) Fibrosis area quantified as the percentage of Sirius red-stained collagen area. Values represent the mean ± SEM. **p<0.01 vs. PBS; ##p<0.01 vs. MSCs. (K) H&E staining to evaluated tissue necrosis in ischemic limbs at 28 days post operation. Scale bar=100 μm. (L) Necrosis area quantified as the percentage of necrosis. Values represent the mean ± SEM. **p<0.01 vs. PBS; ##p<0.01 vs. MSCs.

